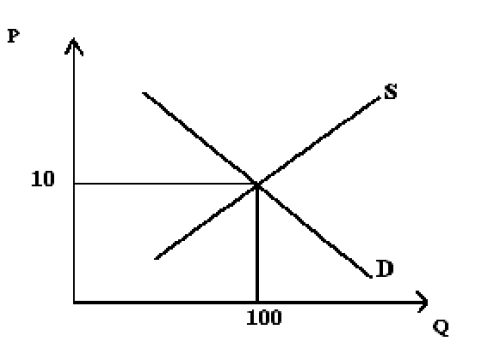
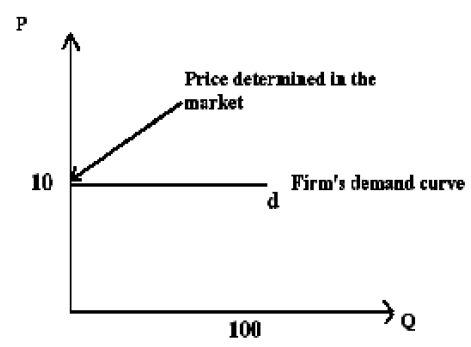
Price is determined by demand and supply in a Perfect Competitive industry.
It can be illustrated by the following diagram.
This can be illustrated with following diagram.
The production in short term is governed by technology and capacity of the firm.
Output and cost is divided on these components.
To obtain maximum loans in a short run, two important decisions should be taken. They are normally,
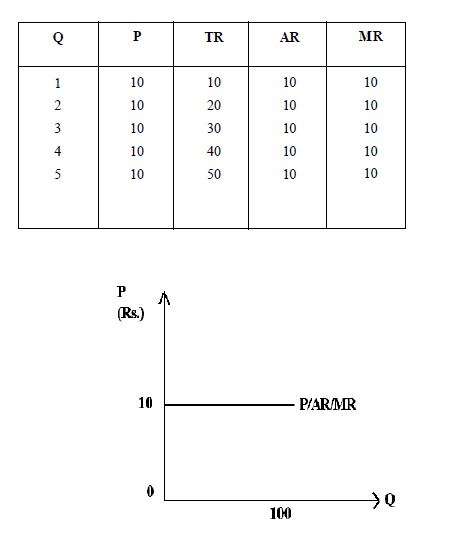
AR = TR / Q
Average Revenue = Total Revenue/ Output
Marginal Revenue = Change in Total Revenue / Change in output
MR = ΔQ / Δ TR
Following schedule and graph can be constructed.
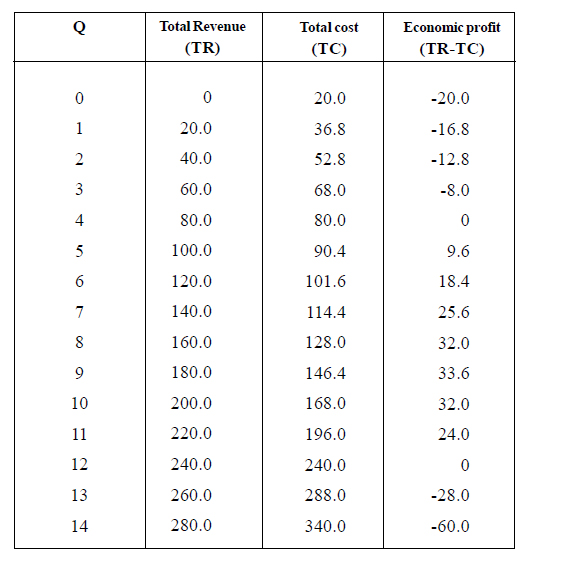
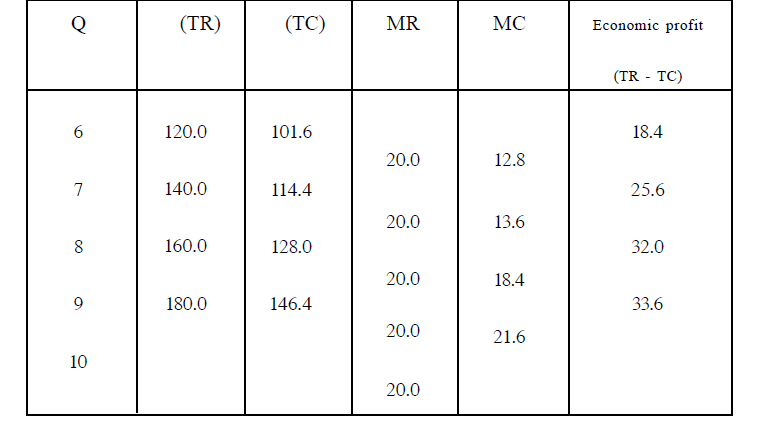
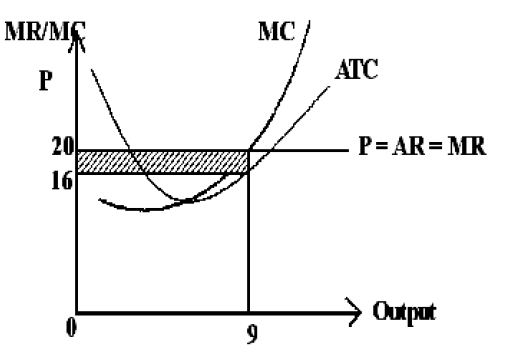
Profit maximization of a perfectly competitive firm can be illustrated through the following
diagram.
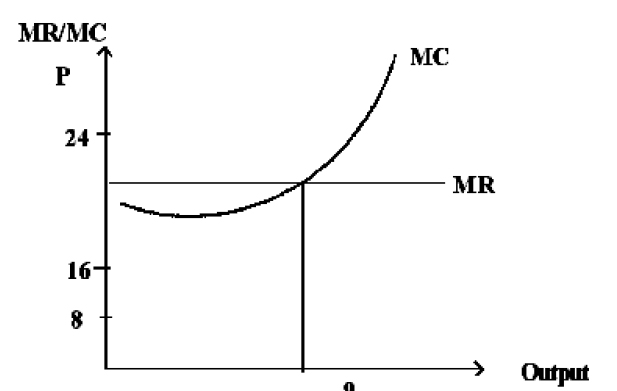
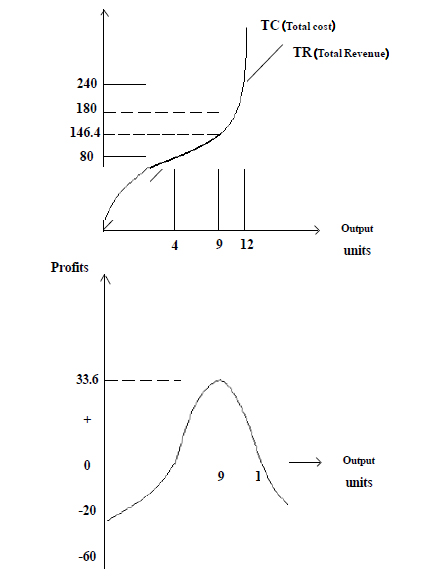
According to the above graph,
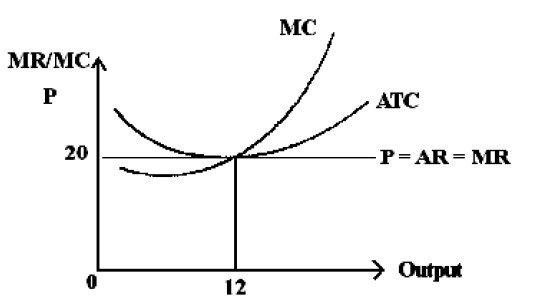
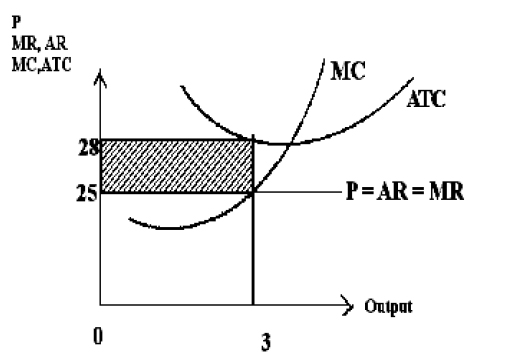
Short run behaviour of a perfectly competitive firm, can be explained through three alternative situations. Such as,
This can be illustrated through the following graph.