Paddy production (in metric tons) in Sri Lanka for the year 2012 is illustrated in the following pie-chart prepared using a spreadsheet software:
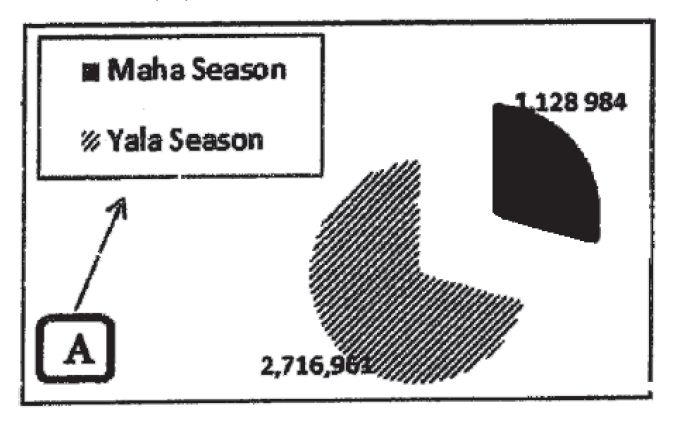
Which of the following parameters has to be set to change the appearance of the section denoted by ‘A’ in the chart?