When the rate of formation of a component in a system becomes equal to the rate of loss of it from the system, it is said to be in a steady state. This process can take place in open or closed systems. In a steady state, macroscopic properties do not change.
Examples :
(i) When the rate of inflow of water into a tank is equal to the rate of outflow, the volume of water in the tank remains the same.
(ii) When the ozone layer is considered, the concentration of ozone remains constant due to the following reactions, so it is at the steady state.
O3(g) →UV radiation O(g) + O2(g) → O3(g)
(iii) The concentration of O2 in the atmosphere remains constant due to various processes that release and consume oxygen.
(iv) Think of a candle burning uniformly. Apparently the flame does not change because the rates of entry and exit of materials to and from it are equal. The above systems are not in equilibrium.
Macroscopic properties
The properties experimentally determined or calculated taking a system as a whole are
macroscopic properties. Here no attention is paid to the particles constituting the system.
Consider the following reversible change taking place in a closed system with only A introduced into it at a constant temperature.
A ⇌ B
Initially, the rate of turning A into B is high and the rate of the reverse change is zero. With the formation of B, the rate of turning B into A increases and the rate of A becoming B decreases. At a certain moment, the rates of forward and backward reactions become equal. At this point, the system is in dynamic equilibrium. This can be shown by the graph given below.

• This kind of equilibria are established only if the change is reversible.
• The equilibrium is attained only in closed systems at constant temperature.
• The equilibrium can be approached starting from either end.
• The equilibrium is dynamic, i.e. both forward and reverse processes occur even at equilibrium at the same rate.
• The macroscopic properties of the system do not change at equilibrium.
• Dynamic equilibria are prevalent both in physical and chemical systems.
The following dynamic equilibrium is established between liquid water enclosed in a
closed container and water vapour in the space above it.
H2O(l) ⇌ H2O(g)
Iodine is a solid which sublimes. The following dynamic equilibrium sets in between iodine crystals and iodine vapour above them when some iodine is kept in a closed bottle.
I2(s) ⇌ I2(g)
The existence of an equilibrium between CO gas adsorbed on to charcoal and CO in the
gas phase inside a closed vessel is another example for this type of an equilibrium.
Consider a dilute solution formed by the dissolution of a gas like O2 in water. When this solution is in contact with a gaseous phase containing O2 such as the atmosphere, following equilibrium is established.
O2(solution) ⇌ O2(g)
These occur when a solute is distributed in two immiscible liquids in contact with each other. For instance, I2 dissolves both in water and CCl4. If some water is added to a solution of I2 in CCl4, iodine starts moving into the aqueous layer. With the increase of iodine concentration in the aqueous layer, iodine passes into the CCl4 layer and at a certain stage an equilibrium is established.
I2(H2O) ⇌ I2(CCl4)
These are equilibria encountered in relation to reversible chemical reactions.
N2(g) + 3H2(g) ⇌ 2NH3(g)
NH4Cl(s) ⇌ NH3(g) + HCl(g)
An ionic system should be a chemical system. Such systems contain ions. An equilibrium establishes between chemicals and ions in such systems.
H2O(l) ⇌ H+(aq) + OH–(aq)
AgCl(s) ⇌ Ag+(aq) + Cl–(aq)
CH3COOH(aq) ⇌ CH3COO–(aq) + H+(aq)
When a metal rod is immersed in a solution of its ions initially the metal atoms lose electrons and enter the solution as ions. The electrons reside in the metal. Consequently the metal becomes negatively charged. As the concentration of the metal ions in the solution increases, they capture electrons from the metal surface and become metal atoms. At a certain instant, the rate of ionization of metal atoms becomes equal to the rate of deposition of ions on the metal. At this equilibrium, the potential difference between the negatively charged metal surface and the positively charged metal ions in solution is called the electrode potential of the metal.
eg. Consider a zinc rod sunk in a Zn2+ ion solution.
Zn2+(aq) + 2e ⇌ Zn(s)
According to equilibrium law:
Where K is a constant called equilibrium constant. The symbol [ ] represents the concentrations of respective species at equilibrium.
• K depends only on temperature and is independent of initial and final concentrations of reactants and products. When expressing the equilibrium constant, the following requirements should be fulfilled.
• The relevant balanced equation for the equilibrium reaction should be given (Generally this is written so that the stoichiometric coefficient assume lowest whole numbers).
• The relevant temperature should be given.
• The physical states of the reactants and products should be given.
Attention should be paid to the following also.
• The equilibrium constant does not give any information with regard to the rate of the reaction.
• The value of K does not depend on initial concentrations.
• The value of K depends on temperature.
• By convention, the products are placed in the numerator of the expression.
• Since concentration of a solid or a pure substance is constant, they are incorporated into the equilibrium constant.
• The units of K depends on the expression for K (However, according to thermodynamic treatment, the equilibrium constant is dimensionless).
• The equilibrium constant expressed in terms of concentrations is known as Kc (‘c’ denotes concentration). The units of Kc depends on the stoichiometric equation for which the expression is written.
eg

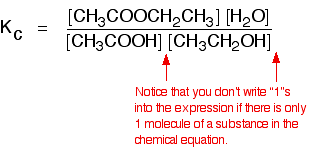


• If the gases in an equilibrium mixture behave ideally,
PV = nRT
n/V = P/RT
c = P/RT
∴At constant temperature, the concentration of a gas is proportional to its pressure. Partial pressure of a gas = mole fraction x total pressure
PG = PT x xG
Partial pressures are therefore proportional to the amount of gases and are used as a measure of concentration of a gas in a gaseous mixture.
• Consider the reaction between nitrogen gas and hydrogen gas, used to produce
ammonia as an example.

If the partial pressures of the individual gases in the equilibrium mixture are PH2,PN2 and PNH3 respectively then the equilibrium constant in terms of partial pressures Kp is given by expression,

• The partial pressures are treated as exact concentrations so they are raised to the power of the respective stoichiometric coefficient in the equation for the reaction.
• The value Kp describes the position of equilibrium and the concentrations of gases that can co-exist in an equilibrium.
• Reversible thermal dissociation in a closed system gives rise to an equilibrium mixture.
eg-In a closed system dissociation of dinitrogen tetraoxide into nitrogen dioxide
Heterogeneous equilibria
This equilibrium is only established if the calcium carbonate is heated in a closed system, preventing the carbon dioxide from escaping.
![]()
![]()
The only thing in this equilibrium which isn’t a solid is the carbon dioxide. That is all that is left in the equilibrium constant expression.
![]()
In a reaction,
aA + bB ⇌ cC + dD
we can write


Assuming the gaseous components to behave ideally,
PiVi = niRT
or

where (i) is the molar concentration of the species ‘i’.


n = (Number of moles of gaseous products)-(Number of moles of gaseous reactants).
Thus, n is equal to the difference in the number of gaseous moles of products and the number of gaseous moles of reactants. The above equation can be rewritten as
Kp = Kc (RT)Δn

• In a closed vessel at constant temperature, the following equilibrium exits between water and water vapour.
H2O(l) ⇌ H2O(g)
• Applying equilibrium law,
Since [H2O(l)] is a constant, K’ =[H2O(g)]
Since the concentration of a gas is proportional to its pressure at constant temperature, K = P0H2O
Where P0 is the saturated vapour pressure of water at the temperature concerned. Hence, the equilibrium constant of this system can be taken as the saturated vapour pressure of water at the temperature concerned
• It is the equilibrium constant describing the distribution of a solute species between two immiscible solvents.
• Immiscible liquids, if shaken together, mix temporarily but eventually separate into distinct phases with the most dense at the bottom and the least dense at the top. A visible boundary, the meniscus, separates two phases.
• The ratio of the concentration of a solute species that is distributed between two immiscible solvents at a given temperature is a constant.
If you have two immiscible liquids like ether and water, and shake them up in a separating funnel, they obviously form two layers. The ether is less dense than water, and so forms the top layer.
Now suppose you shake up a mixture of ether and water containing a substance which is soluble in both of them. Let’s suppose that the substance, X, is more soluble in ether than it is in water.
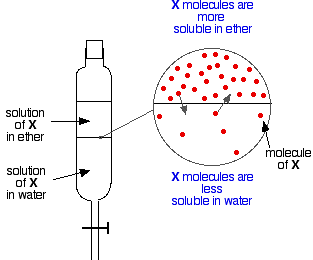
Particles of X will cross the boundary between the two liquid layers, and you will soon get a dynamic equilibrium set up. For every particle which moves into the top layer, one will move back down into the bottom one.
You could write an equation for this:
![]()
![]()
. . . and like any other equilibrium, you can find an equilibrium constant:
![]()
![]()
This equilibrium constant is called the partition coefficient, and is often given the symbol KD.
Like other equilibrium constants, partition coefficients are constant at a constant temperature, but they have some other restrictions as well. They only work properly for fairly dilute solutions, and the solute must be in the same chemical form in both solvents. It mustn’t react, or ionise or associate (join together in dimers, for example)
• The extent of a chemical reaction when equlibrium is established is called the position of equlibrium. This varies from one reaction to another and depends upon the temperatue at which the reaction is performed. The equlibrium constant is a measure of the position of an equlibrium. If equlibrium constant is more than one, then the position of equlibrium is said to lie towards the right.
• The position of equilibrium is not fixed for a reaction but changes as you change the reaction conditions. When a system which is in dynamic equilibrium is disturbed, it tends to respond in such a way as to minimize the disturbance and to restore equilibrium. This is known as Le Chatelier’s principle.
• The following factors change the equilibrium point.
– Concentration
– Pressure
– Temperature
Le Chatelier’s principle can be used to deduce the effect of change of those factors on equilibrium.
• Le Chatelier’s principle is a qualitative treatment of the equilibrium law. Whenever possible attempt must be made to explain facts quantitatively using equilibrium law.
Attention should be paid to the following.
1. Change in concentration of each substance.
2. Increasing the pressure of the system (Decrease in volume here can be considered as an increase in concentration).
3. Introduction of an inert gas or gas that does not affect the reaction, into the system.
4. The influence of temperature on the equilibrium constant is not discussed. Therefore, use Le Chaterlier’s principle to predict the results of changes in temperature takingexothermic/endothermic nature of the reaction.
5. A catalyst does not change the position of the equilibrium.
• Consider the molecules of a liquid A and its vapour are in random motion. If the liquid is in an open container, the molecules in the vapour phase spread. Consequently, more and more molecules enter the vapour phase from the liquid phase till the whole liquid evaporates.
• When the evaporation occurs in a closed space, molecules enter the vapour phase from the liquid phase and vice versa and a dynamic equilibrium is established between the two phases at the temperature concerned. At this equilibrium, the rate of evaporation is equal to the rate of condensation.
A(l) ⇌ A(g)
However, the microscopic changes are not observable. If the temperature remains unchanged the pressure exerted by the vapour at equilibrium remains constant and it is the saturated vapour pressure at the particular temperature. This itself is an equilibrium constant.
• The kinetic energy of molecules depends on the temperature. When the temperature rises, the kinetic energy increases and the molecules with high kinetic energy overcome the intermolecular forces and move into the vapour phase. The higher the intermolecular attractions, the lesser the tendency of the molecules to pass into the vapour phase.
• As more and more molecules move into the vapour phase, the vapour pressure increases. Hence with increasing temperature, the vapour pressure also increases. When the temperature is decreased, the kinetic energy of the molecules in the vapour phase decreases with the result that more molecules return to the liquid phase and the vapour pressure drops.
• When the liquid is heated, the temperature rises and at a certain temperature the saturated vapour pressure becomes equal to the (external) atmospheric pressure. At this temperature, the liquid boils and therefore, it is the normal boiling point of the liquid.
• The increase in vapour pressure of liquids with temperature is not linear . Moreover, different liquids have different intermolecular attractive forces and hence different volatilities. Therefore, the temperatures at which their s.v.p. becomes equal to the atmospheric pressure are different, so they boil at different temperatures
• Consider the liquid-vapour equilibrium established in a closed system. With rise in temperature the equilibrium is disturbed and more molecules pass into the vapour phase from the liquid phase establishing new equilibria increasing the amount in the gas phase. Finally a stage is reached where only the vapour exists.
• This vapour can be liquefied by compression. However, the tendency of the vapour to liquefy decreases with increasing temperature. Hence, a gas has a characteristic minimum temperature, called the critical temperature, above which the gas cannot be liquefied by increasing pressure, no matter how high the pressure would be.
The minimum pressure required to bring about liquefaction at the critical temperature is known as the critical pressure and the volume of one mole of the substance at the critical temperature and critical pressure is known as the critical volume.
• The following phase diagram of water shows the variation of vapour pressure of water with temperature (curve TC) and vapour pressure of ice with temperature (curve AT). Line BT shows the temperatures and pressures at which ice and liquid water are in equilibrium.
At the point T ice, water and vapour exist together in equilibrium, and this point is known as the triple point. The curve TC ends at the critical temperature (647.4 K) of water. Above this temperature only the vapour phase can exist.
• Liquid-liquid systems can be classified as
– Totally miscible liquid-liquid systems
e.g. water and ethanol, hexane and heptane, benzene and toluene.
– Partially miscible liquid-liquid systems
e.g. water and butanol, water and ether
– Totally immiscible liquid-liquid systems
e.g. water and tetrachloromethane
In the case of a binary solution composed of totally miscible liquid components A and B, it may be possible that f(A-B) = f(A-A) = f(B-B) where f denotes inter-molecular attractive forces or interactions. Such a solution is called an ideal solution. When the components of an ideal solution are mixed (a) the volume does not change and (b) the enthalpy does not change (and hence there is no observable change in temperature).
• When an ideal solution of A and B evaporates into a vacuum in a closed space, the molecules of both A and B with sufficient kinetic energy to surmount the liquid phase interactions escape from the surface into space above. At the same time, the molecules of A and B in motion in the vapour phase return to the liquid phase. When the rates of these two processes are equal, a dynamic equilibrium sets in. This is testified by the consistency of (a) the total vapour pressure (to which partial pressures of A and B contribute) and (b) the composition of the vapour phase at a constant temperature.
• The composition of the vapour depends on (a) the relative volatilities of A and B (and hence their boiling points) and (b) the relative concentrations of A and B in the solution.
• The higher the volatility and the higher the concentration of a certain component the greater is its tendency to be in the vapour phase and to exert a higher partial pressure.
• In order to find the composition of the vapour of an ideal binary solution quantitatively, let us consider the equilibria existing in a liquid-vapour system.
A(l) ⇌ A(g) ——-(1)
B(l) ⇌ B(g) ——-(2)
If R1 is the rate of moving A from liquid phase to gas phase
R1= k/ [A(l)]
Since [A(l)] is proportional to its mole fraction xA in the liquid phase,
R1= k1 × xA ——-(3)
If R2 is the rate of moving A from gas phase to liquid phase
R2= k” [A(g)]
Since [A(g)], is proportional to its partial pressure PA
R2= k2 × PA ———(4)
At equilibrium R1= R2
According to (3) and (4)
k2PA = k1xA
∴PA = (k1/k2)xA
∴PA = k xA
When xA = 1, PA = P0A
k = P0A
PA= P0A. xA
∴Similarly PB= P0B
Thus, in an ideal solution, the partial pressure of a given component A is equal to the product of the vapour pressure of pure A and the mole fraction of A in the liquid phase at constant temperature. This relationship is called Raoult’s law.
• It is understood that PA < P0A
and PB < P0B
Hence lowering in the vapour pressure of A = P0A– PA = P0A – P0A. xA =P0A (1 – xA ) =P0A. xB
∴ ( P0A– PA )/ P0A = xB
This is an alternate form of Raoults’ law.
• Combining Raoults’ law with Dalton’s law of partial pressures, makes it possible to determine the composition of the vapour phase. If PAB is the total vapour pressure and yA and yB are the mole fractions of A and B in the vapour phase respectively :
PA = PA yA
∴PA = (PA + PB ) yA
∴P0A. xA = (P0A. xA + P0B. xB) yA
• According to Raoult’s law PA= P0A. xA . Since P0A is a constant at constant temperature,the graph of the partial vapour pressure of a component against its
mole fraction in an ideal solution is a straight line.
• Assuming A is more volatile than B(i.e. P0A > P0B and ∴ Tb(A) < Tb(B) the plot of vapour pressures versus mole fractions of an ideal solution will be as follows.
Here PAB is total pressure and PA and PB are vapour pressure of A and B respectively
examples -Hexane and heptane, benzene and toluene, bromoethane and iodoethane, CCl4 and CHCl3,C6H6 and C6D6 (Note : PAB at a given composition is equal to PA + PB).
The boiling boint-composition graph, however, is not a straight line.
• Ideal solutions obey Raoults law. There are solutions which deviate from Raoult’s law. In these f(A-B) ≠ f(A-A) ≠ f(B-B). These are non ideal solutions.
• In some f(A-B) >f(A-A) , f(A-B) >f(B-B) and and the freedom for molecules to escape into the vapour phase is lesser than in the case of an ideal solution.
PA< P0A. xA
PB< P0B. xB
PAB < ( P0A. xA + P0B. xB )
Therefore, the curves in the vapour pressure – composition diagram dips downwards whereas the boiling point – composition curve rises up.
e.g. Propanone and methanol, trichloromethane and propanone, ethanoic acid and water.
These solutions are said to exhibit a negative deviation. When components of such solutions are mixed, temperature increases and volume decreases.
In some others f(A-B) < f(A-A) , f(A-B) < f(B-B) and the molecules tend to escape more freely into the vapour phase than in the case of an ideal solution
PA> P0A. xA
PB> P0B. xB
PAB > ( P0A. xA + P0B. xB )
Thus the curves in the vapour pressure – composition diagram loops upwards. The boiling point curve dips downwards.
e.g. Propanone and carbon disulphide, ethanol and benzene.
These solutions show positive deviations from Raoult’s law.
When solvents of such solutions are mixed, temperature decreases and volume increases.
• Simple distillation can be used to get pure water from a solution of salt in water.
• In addition to a distillation flask, for distillation a condenser is also need
• In simple distillation only one component enters the vapour phase.
Using the phase diagram
. 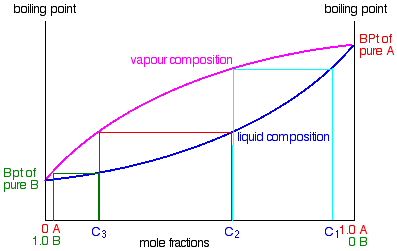
If you boil a liquid mixture C1, you will get a vapour with composition C2, which you can condense to give a liquid of that same composition (the pale blue lines).
If you reboil that liquid C2, it will give a vapour with composition C3. Again you can condense that to give a liquid of the same new composition (the red lines).
Reboiling the liquid C3 will give a vapour still richer in the more volatile component B (the green lines). You can see that if you were to do this once or twice more, you would be able to collect a liquid which was virtually pure B.
The secret of getting the more volatile component from a mixture of liquids is obviously to do a succession of boiling-condensing-reboiling operations.
The apparatus
A typical lab fractional distillation would look like this:
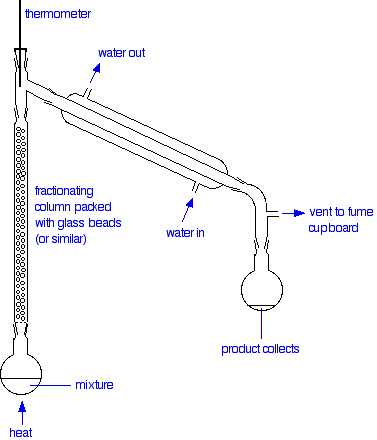
The fractionating column is packed with glass beads (or something similar) to give the maximum possible surface area for vapour to condense on. Some fractionating columns have spikes of glass sticking out from the sides which serve the same purpose.
The mixture is heated at such a rate that the thermometer is at the temperature of the boiling point of the more volatile component. Notice that the thermometer bulb is placed exactly at the outlet from the fractionating column.
Relating what happens in the fractionating column to the phase diagram
Suppose you boil a mixture with composition C1.
The vapour over the top of the boiling liquid will be richer in the more volatile component, and will have the composition C2.
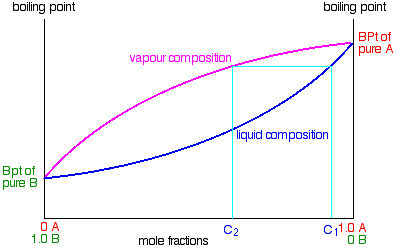
That vapour now starts to travel up the fractionating column. Eventually it will reach a height in the column where the temperature is low enough that it will condense to give a liquid. The composition of that liquid will, of course, still be C2.
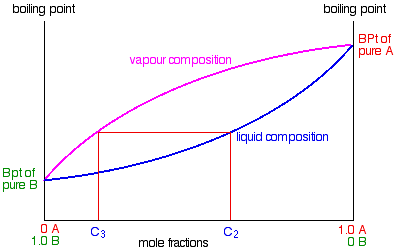
Some of the liquid of composition C2 will boil to give a vapour of composition C3. Let’s concentrate first on that new vapour and think about the unvaporised part of the liquid afterwards.
The vapour
This new vapour will again move further up the fractionating column until it gets to a temperature where it can condense. Then the whole process repeats itself.
Each time the vapour condenses to a liquid, this liquid will start to trickle back down the column where it will be reboiled by up-coming hot vapour. Each time this happens the new vapour will be richer in the more volatile component.
The aim is to balance the temperature of the column so that by the time vapour reaches the top after huge numbers of condensing and reboiling operations, it consists only of the more volatile component – in this case, B.
Whether or not this is possible depends on the difference between the boiling points of the two liquids. The closer they are together, the longer the column has to be.
The liquid
So what about the liquid left behind at each reboiling? Obviously, if the vapour is richer in the more volatile component, the liquid left behind must be getting richer in the other one.
As the condensed liquid trickles down the column constantly being reboiled by up-coming vapour, each reboiling makes it richer and richer in the less volatile component – in this case, A. By the time the liquid drips back into the flask, it will be very rich in A indeed.
So, over time, as B passes out of the top of the column into the condenser, the liquid in the flask will become richer in A. If you are very, very careful over temperature control, eventually you will have separated the mixture into B in the collecting flask and A in the original flask.
• The solubility of NaCl in water is approximately 5 mol dm-3. In the solution there are interactions between Na+ and Cl– ions. Though simple, they are not independent of one another.
• In the case of a sparingly soluble electrolyte such as BaSO4, the ions exist independently in the solution and the following dynamic equilibrium exists between the solid and the ions in a saturated solution.

Applying the law of equilibrium
[BaSO4(s)] is a constant. Therefore,

• Ksp is a constant at constant temperature and is called ‘solubility product’. If the solubility of BaSO4 is x mol dm-3, Ksp = x2 mol2 dm-6.
• In general, solubility product is not applied for salts having high solubility.
• If the ionic product is greater than the solubility product of a salt, it will precipitate.
eg. If [Ba2+][SO42-] > Ksp BaSO4 will precipitate.
Example
The solubility of magnesium hydroxide at 298 K is 1.71 x 10⁻⁴mol dm-3. Calculate the solubility product.
The equilibrium is:
![]()
![]()
For every mole of magnesium hydroxide that dissolves, you will get one mole of magnesium ions, but twice that number of hydroxide ions.
So the concentration of the dissolved magnesium ions is the same as the dissolved magnesium hydroxide:
![]() [Mg2+] = 1.71 x 10⁻⁴ mol dm-3
[Mg2+] = 1.71 x 10⁻⁴ mol dm-3
The concentration of dissolved hydroxide ions is twice that:
![]() [OH–] = 2 x 1.71 x 10-4 = 3.42 x 10⁻⁴ mol dm-3
[OH–] = 2 x 1.71 x 10-4 = 3.42 x 10⁻⁴ mol dm-3
Now put these numbers into the solubility product expression and do the sum.
![]()

• On addition of NaCl solution to a saturated solution of AgCl, concentration of Cl– ions increases. Since Ksp is a constant at constant temperature Ag+ concentration in the medium should decrease. Therefore, AgCl is precipitated. In other words, the solubility of AgCl in a solution ofup> ions is less compared to its solubility in pure water. This is called common ion effect. This principle is applicable for the Ag+ ion as well.
Pure water being a weak electrolyte under goes self ionization to a small extent as follows:

The equilibrium constant for this reaction is: 
The concentration of unionized water is taken as constant because the degree on ionization of water is very small. So we can write this equation as:

where Kw is a constant and is known as the ionic product of water whose value is 1.008 x 10⁻¹⁴ mol2 dm–6 at 298 K. In pure water the concentration of H3O+ and OH– are equal and so we can write,
[H3O+] = [OH–]
If, Kw = [H3O+] [OH–] = 1.008 x 10⁻¹⁴ mol2 dm–6 then,
[H3O+] [OH–] = 1.008 x 10⁻¹⁴
[H3O+]2 = 1.008 x 10⁻¹⁴
Thus in pure water [H3O+] = [OH–] = 1.0 x 10⁻⁷ mol dm–3 at 298 K
The value of Kw varies with the change in temperature. The values of [H3O+] and [OH–] are always equal to each other at all temperatures but the values of Kw are different at different temperatures. The value of Kwincreases with the rise in temperature. This is because increase in temperature will shift the equilibrium in the forward direction producing large concentrations of [H3O+] and [OH–] ions (Le Chatelier’s principle).
![]()
Hence, Kw increases with rise in temperature.
It can be concluded that the hydronium and hydroxyl ions are always present in solution whether they are acidic or basic. However their concentrations differ.

An acid HA takes part in the following proton transfer equilibrium in water
HA(aq) + H2O(l) ⇌ H3O+(aq) + A–(aq)
In this expression, A– is the conjugate base of the acid.
In dilute solution, the concentration of water is constant and the equilibrium can be expressed in terms of the equilibrium constant, Ka.
Ka is the ionisation constant or dissociation constant of the acid.
For acetic acid
![]()
Ka is a measure of the acidic strength of the acid.
• For a base B in water, the characteristic proton transfer equilibrium is
B(aq) + H2O(l) ⇌ BH+(aq) + OH–(aq)
Here, BH+ is the conjugate acid. In dilute solutions concentration of H2O is constant.
Kb is the ionisation or dissociation constant of the base. It is a measure of the strength of the base.
For Ammonia,
NH3(aq) + H2O (l) ⇌ NH4+(aq) + OH–(aq)
Kb = ( [NH4+] [OH¯] ) / [NH3]
Kb is a measure of the strength of the base.
Let BH+ be the conjugate acid of a base, then the expression for the acidic constant Ka for the conjugate acid:
          [B] [H+]
  Ka  =  ---------
           [BH+]

          [B] [H+]  [OH-]
      =  --------- ------
           [BH+]    [OH-]

           [B]
      =  -----------  [H+] [OH-]
         [BH+] [OH-]

          1
      =  --- Kw
          Kb
Thus, Ka Kb = Kw
Furthermore,
– log ( Ka) – log (Kb) = -log (Kw)
and at 298 K, we have
p Ka + pKb = 14
• Weak acids and weak bases partially dissociate in water leading to equilibria
• Strong acids like HCl, HNO3 and strong bases like NaOH completely ionise in water.
![]() Therefore, the H+ and OH– concentration can be directly computed considering the
Therefore, the H+ and OH– concentration can be directly computed considering the
dissociation.
An acid of the type HA can undergo ionization when dissolved in water as,

If ‘n’ moles of the acid are dissolved in ‘V’ units of volume (litres L) and ‘a‘ is the degree of ionization, then the equilibrium amounts of various species and the concentration in moles per litre in the solution are,
Note that 1 L = 1 dm3


where ‘C’ is the molar concentration of the acid. The ionization constant for the above reaction is given by,


where ‘V’ is the volume of the solution in litres containing one mole of the acid HA. As the degree of ionization increases with-dilution then, the hydronium ion or hydrogen ion concentration is given by,
The ionization of a weak base is characterized by the equilibrium,

If ‘n’ moles of the base are dissolved in ‘V’ units of volume (litres L) and a is the degree of ionization, then the equilibrium amounts of various species and the concentration in moles per litre in the solution are,

where ‘C’ is the molar concentration of the base. The ionization constant for the above reaction is given by,

If ‘α‘ is small then 1 – α ≈ 1
Hence, Kb = Cα2

where ‘V’ is the volume of the solution in litres containing one mole of the base MOH. As the degree of ionization increases with dilution then, the hydroxide concentration is given by,
• The concentration of hydronium ions [H3O+] in aqueous solutions is sometimes very small. Hydronium ion concentration of a medium is very important in industrial processes, pollution, acid rain, blood and body chemistry. In many cases its concentration ranges from 10-14 to 10 mol dm-3 in aqueous solutions.
• Therefore it is convenient to express the [H3O+] of solutions on logarithmic scale. The negative logarithm of hydronium ions or hydrogen ions concentration is called pH. The ‘p’ in the term pH means power and ‘H+‘ stands for hydronium ions or hydrogen ions. The pH is defined mathematically as,
• The negative sign in the definition means that the pH decreases as the hydrogen ion (hydronium ion) concentration increases. A change of one unit in the pH scale corresponds to tenfold change in the hydrogen ion concentration.
• It is assumed that all strong acids are completely ionised in aqueous solution. The hydronium ion concentration is obtained directly from the concentration of the acid. For monoprotic strong acids [H3O+] is equal to its molar concentration.
Eg. If the concentration of hydrochloric acid solution is 0.1 mol dm-3.
HCl(aq) + H2O(l) → H3O+(aq) + Cl–(aq)
∴ [H3O+(aq) ] = 0.1 mol dm-3
-log10 0.1 = 1
∴ pH = 1
• Molecules of diprotic strong acids such as sulphuric acid dissociates completely in dilute solutions.
H2SO4(aq) + 2H2O(l) → 2H3O+ (aq) + SO42- (aq)
In 0.1 mol dm-3 sulphuric acid solution, [H3O+(aq)] = 0.2 mol dm-3 (assuming complete dissociation)
log10 0.2 = -0.7
∴ -log10 0.2 = 0.7
∴ pH = 0.7
• Strong bases are also assumed to be completely ionised. The hydroxide ion concentration is therefore easily obtained from the concentration of the base.
eg. Consider 0.3 mol dm-3 solution of sodium hydroxide.
NaOH (aq) → Na+(aq) + OH–(aq)
[OH–(aq)] = 0.3 mol dm-3
• The hydrogen ion concentration of the solution is determined by the ionic product of water. At 298 K the ionic product is 1×10-14 mol2 dm-6. Hydrogen ion concentration at this temperature is given by
• A weak acid does not ionise fully in aqueous solution

By applying equilibrium law,

the degree of dissociation is α and the initial concentration of HA is C


![]()
pH = -log10√(KaC)
Similarly
pOH = -log10√(KbC)
Let’s take the simplest example absolute; sodium chloride, NaCl. The constituent ions are Na+ and Cl–. The acid-base theory of Bronsted-Lowry has taught us that the more strong the base the weaker it will be its conjugate acid and vice versa, the more strong the acid the weaker will be its conjugate base.
In this case, we have Na+, which is the conjugate acid of NaOH, and Cl–, which is the conjugate base of HCl. NaOH is a strong base, and in the same way HCl is a strong acid. It follows that the Na+ acid behavior and Cl– basic behavior are totally irrelevant.
If none of the two ions interacts with H2O then we will have no pH changes.
It follows that the pH of an aqueous solution of NaCl is neutral, 7.
The salts derived from strong acid and strong base leave unchanged the pH of a solution.
Take for example the sodium acetate, CH3COONa. And ‘it is including respectively CH3COO– and Na+. Na+ is the conjugate acid of NaOH,and as we saw in the previous example, its contribution to the pH is null. CH3COO– instead it is the conjugate base of CH3COOH, a weak acid. As the conjugate base of a weak acid, it shows a certain affinity towards the proton, and it behaves then as a base:
The acid-base reaction of CH3COO– with water is called “hydrolysis.” In this case we are speaking of basic hydrolysis, because the reaction generates an excess of OH– .Since the reaction generates this excess, the salt of a weak acid and a strong base in water give a pH> 7, therefore alkaline. For the calculation of pH, we can consider the solution of this salt exactly as the solution of just a weak base (in our case CH3COO–). We have seen that the formula for calculating generated resulting from a weak base is:
The Kb of the weak base CH3COO– can be obtained from Ka of acetic acid as it follows:
The base concentration in this case is the concentration
of our salt.
From this considerations the formula for calculating the a salt-strong base weak acid solution:
pOH = -log10√(KwC/Ka)
Take for example the ammonium chloride, NH4Cl. Its constituent ions are NH4+ and Cl– .NH4+ is the conjugate acid of NH3, ammonia, a weak base. It will therefore have a tendency, altough small, to cede that acid hydrogen. Cl– instead is the conjugate base of HCl, and as we have seen in the examples above its contribution to the pH is practically zero, and then we can overlook it. We can simply consider a solution of this salt as an aqueous solution of the weak acid NH4+ (which will then give an acid pH)
The approximate formula to calculate the pH of a weak acid is the following:
The Ka of the ammonium ion can be easily obtained from the Kb of ammonia. The concentration of acid in the formula, Ca , is therefore in this case the concentration Cs of our salt.
Let’s take for example ammonium acetate, CH3COONH4. The constituent ions are CH3COO– and NH4+. Both of these ions are able to give hydrolysis (as we have seen in the previous examples); CH3COO– gives basic hydrolysis, while acid hydrolysis is given by NH4+ .The pH of a salt composed of weak acid and weak base will depend on the strength relationship of the acidic and basic components of the salt. If the base strength and the acid strength are equal the result is a neutral solution. And that’s right the case for example of CH3COONH4 .
Ka NH4+ = Kb CH3COO–
If base strength is prevailing on acid strength the salt will give the solution an alkaline pH. And that’s the case for example of NH4CN.
Kb CN– > Ka NH4+
If the prevailing acid strength on the base strength of course the result will be an acid pH.
In any case if we want to exactly calculate the pH of a salt formed by weak acid and weak base (also what we called a neutral solution if we wanted to be accurate, has to be calculated like this because Ka and Kb are always at least slightly different), there is a very simple formula:
In which:
– Ka is the constant of the conjugate acid of the weak base which forms the salt. For example, in the case of CH3COONH4 would be the Ka of CH3COOH.
– Kb is the constant of the conjugate base of the weak acid that constitutes the salt. For example, in the case of CH3COONH4 would be the Kbof NH3.
pH Determination
The pH value of a solution can be determined using
• indicators
• indicator papers
• pH meter
Theory of indicators
Any acid – base indicator is a weak acid or a weak base. They show one colour below a certain pH value and another colour above a certain pH value.
Consider acid-base indicator as weak acid which can be represented as HIn which takes part in the following equilibrium.
HIn(aq) + H2O(l) ⇌ H3O+(aq) + In–(aq)
Colour I Colour II
Instead of Ka the equilibrium is described by the constant KIn to show that indicator is used.
KIn = [H3O+(aq)][In–(aq)]/[HIn(aq)]
-log10KIn = -log10[H3O+(aq)]- -log10[In–(aq)]- (-log10[HIn(aq)])
pKIn = pH + log10[In–(aq)]/[HIn(aq)]
The HIn and In– are of two different colours.
The addition of acid to this solution will push the equilibrium to the left and the colour of HIn will become prominent.
Addition of alkali will result in the equilibrium moving to the right since the OH – will remove the H3O+ ion from the equilibrium and the colour of In– will become prominent.
Colour I displayed at a lower pH may be called ‘lower colour’ and the colour II shown at higher pH can be called the’ higher colour’.
When the pH of the solution becomes equal to pKIn, an intermediate colour of an equimolar mixture of HIn and In– is shown.
When the pH range of a particular indicator is equal to pKIn + 1 and pKIn – 1 the colour change occurs over a pH range of about 2 units.
• To select the suitable indicator for a particular titration, pH range of the colour change of the indicator should be in the abrupt pH range (vertical portion) that embraces equivalence point of the titration.
• If pH at equilibrium of a titration is equal to the pKIn of an indicator, that indicator fits well for that titration.
| Indicator | Color | pKIn | pH range | |
| Acid | Base | |||
| Thymol Blue – 1st change | red | yellow | 1.5 | 1.2 – 2.8 |
| Methyl Orange | red | yellow | 3.7 | 3.2 – 4.4 |
| Bromocresol Green | yellow | blue | 4.7 | 3.8 – 5.4 |
| Methyl Red | yellow | red | 5.1 | 4.8 – 6.0 |
| Bromothymol Blue | yellow | blue | 7.0 | 6.0 – 7.6 |
| Phenol Red | yellow | red | 7.9 | 6.8 – 8.4 |
| Thymol Blue – 2nd change | yellow | blue | 8.9 | 8.0 – 9.6 |
| Phenolphthalein | colorless | magenta | 9.4 | 8.2 – 10.0 |
Calculation of pH value of acid-base reactions at different points and drawing pH curves
• The point at which the reaction completed is called the equivalence point. At the equivalence point of a strong acid- strong base titration,
[H +(aq)] = [ OH – (aq)]
• In strong acid –strong base titration neither cation (eg. Na+, K+) nor the anion (eg. HCl–,NO3–) undergoes hydrolysis at the equivalence point. Therefore, pH at equivalence point is 7.0. Here pH at the equivalence point is determined only by the dissociation of H2O.
• But in other titrations cations of weak base and anions of weak acid undergo hydrolysis and determine the pH of the resulting solution.
We’ll take hydrochloric acid and sodium hydroxide as typical of a strong acid and a strong base.
![]()
![]()
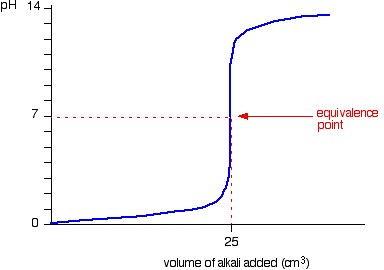
• Titration shows a rapid change in pH from 3 – 11 around its equivalence point. Hence any indicator having pKIn in this range can be used to detect the end point of the titration.
eg. Methyl orange (pKIn = 3.7), Bromothymol blue (pKIn = 7),Phenolpthalene (pKIn = 9.6)
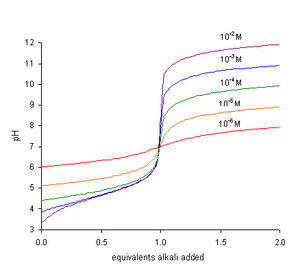
• When concentrations of reactants are low the range in which a rapid change is shown becomes narrow.
We’ll take ethanoic acid and sodium hydroxide as typical of a weak acid and a strong base.
![]()
![]()
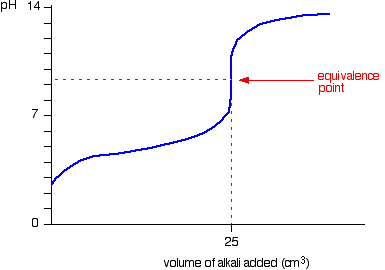
The start of the graph shows a relatively rapid rise in pH but this slows down as a buffer solution containing ethanoic acid and sodium ethanoate is produced. Beyond the equivalence point (when the sodium hydroxide is in excess) the curve is just the same as that end of the HCl – NaOH graph.
For the above titration a rapid change in pH shows around 7.5 to 10. Therefore, the suitable indicator is phenolpthalene. (pKIn = 9.6)
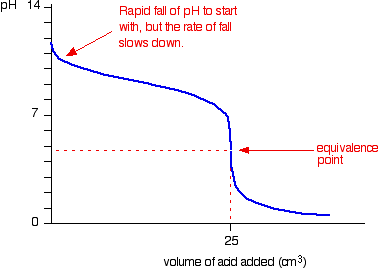
Because you have got a weak base, the beginning of the curve is obviously going to be different. However, once you have got an excess of acid, the curve is essentially the same as before.
At the very beginning of the curve, the pH starts by falling quite quickly as the acid is added, but the curve very soon gets less steep. This is because a buffer solution is being set up – composed of the excess ammonia and the ammonium chloride being formed.
For the above titration a rapid change in pH shows around 3 to 6. Therefore, one of the
suitable indicators is methyl orange.
(4) For weak acid – weak base titrations there is no rapid change in pH around the equivalence point. Therefore, it is very difficult to accurately detect the end point by using an indicator.
The overall equation for the reaction between sodium carbonate solution and dilute hydrochloric acid is:
![]()
![]()
If you had the two solutions of the same concentration, you would have to use twice the volume of hydrochloric acid to reach the equivalence point – because of the 1 : 2 ratio in the equation.
Suppose you start with 25 cm3 of sodium carbonate solution, and that both solutions have the same concentration of 1 mol dm-3. That means that you would expect the steep drop in the titration curve to come after you had added 50 cm3 of acid.
The actual graph looks like this:
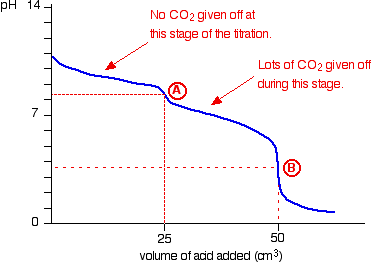
The graph is more complicated than you might think – and curious things happen during the titration.
You expect carbonates to produce carbon dioxide when you add acids to them, but in the early stages of this titration, no carbon dioxide is given off at all.
Then – as soon as you get past the half-way point in the titration – lots of carbon dioxide is suddenly released.
The graph is showing two end points – one at a pH of 8.3 (little more than a point of inflexion), and a second at about pH 3.7. The reaction is obviously happening in two distinct parts.
In the first part, complete at A in the diagram, the sodium carbonate is reacting with the acid to produce sodium hydrogencarbonate:
![]()
![]()
You can see that the reaction doesn’t produce any carbon dioxide.
In the second part, the sodium hydrogencarbonate produced goes on to react with more acid – giving off lots of CO2.
![]()
![]()
That reaction is finished at B on the graph.
It is possible to pick up both of these end points by careful choice of indicator. That is explained on the separate page on indicators.
• It can be shown either by calculation or using pH papers that pH of chemically pure water can be changed by 3 units by adding 1 cm3 of 0.1 mol dm-3 HCl or NaOH to 1.0 dm3 of water. This shows that a small amount of an acid or an alkali can cause a drastic change in pH. But there are solutions/systems that can resist such changes.
• A buffer solution is a one which resists the change in pH on addition of a small amount of H+ or OH– or water.
• The following table shows how pH changes when the given volumes of a 0.1 mol dm-3 NaOH solution are added to 50.00 cm3 of a 0.1 mol dm-3 CH3COOH solution.
• According to the above table, the change in pH in between the addition of 10.00 cm3 and 25.00 cm3of NaOH solution is very small showing that in this range, the system is resistant to the change in pH brought about by the addition of NaOH. This action is called buffer action.
• Solutions containing a weak acid and its conjugate base act as buffers.
eg. CH3COOH and CH3COONa.
• Solutions containing a weak base and its conjugate acid also act as buffers.
eg. NH4OH and NH4Cl.
CH3COONa(aq) → CH3-(aq) + Na+(aq) (Complete dissociation)
CH3COOH(aq) + H2O(l) ⇌ CH3COO–(aq) + H3O+(aq) (Incomplete dissociation)
When H3O+ ions are added to the system, they are removed by the CH3COO– ion forming weakly dissociated CH3COOH. Therefore, pH almost remains constant
When a small amount of OH– ions are added to the system, they are immediately removed forming almost unionised water.
OH–(aq) + H3O+(aq) ⇌ 2H2O(l)
More CH3COOH ionises to replenish the lost H3O+, so pH remains almost constant.
NH4OH(aq) ⇌ NH4+(aq) + OH–(aq)
NH4Cl(aq) → NH4+(aq) + Cl–(aq)
When a small amount of an acid is added, H+ ions are removed by the OH– forming water and more NH4OH ionises restoring the OH– ions. Hence, pH does not change widely. When an alkali is added, OH– ions combine with NH4 + to form NH4OH bringing down the OH– concentration. Hence, pH approximately remains constant.
Here is the dissociation equation for HA:
HA ⇌ H+ + A–
From which, we write the Ka expression:
take the negative log of each of the three terms in the above equation. They become:
1) -log [H+]
2) – log Ka
3) -log ([HA] / [A¯])
However,
1) this is the pH
2) this is the pKa
3) to get rid of the negative sign flip the log term to get this: + log ([A¯] / [HA])
Inserting these last three items (the pH, the pKa and the rearranged log term), we arrive at the Henderson-Hasselbalch Equation:
Here is a common way the HH equation is presented in a textbook explanation:
Remember that, in a buffer, the two substances differ by only a proton. The substance with the proton is the acid and the substance without the proton is the salt.
However, remember that the salt of a weak acid is a base (and the salt of a weak base is an acid).
Consequently, another common way to write the Henderson equation is to substitute “base” for “salt form” (sometimes you will see “conjugate base” or “base form”). This is probably the most useful way to decribe the interactions between the acidic form (the HA) and the basic form (the A¯).
Here it is:
The alternate form starts from the ionization equation for a generic base called B:
B + H2O ⇌ HB+ + OH¯
By the way, here is an example of the above generic equation, using ammonia:
NH3 + H2O ⇌ NH4+ + OH¯
The B simply represents the entire base and HB+ represents the substances with an additional H+.
Next, we write the Kb expression for this reaction:
Next, we isolate the [OH¯] on the left-hand side of the equation:
We negative log each of the three terms of the above equation to give pOH, pKb and we flip the third term so as to make it an addition, not a subtraction.
Here is the alternate form of the Henderson-Hasselbalch Equation, expressed in terms of pOH and pKb:
• Rate of a reaction can be defined as the change of concentration (either decrease of
concentration of reactants or increase of concentration in products) within a unit time.
• Factors affecting rate of reactions
– Temperature
– Concentration (Pressure)
– Physical nature (Surface area of reactants)
– Catalysts (Heterogeneous/Homogeneous)
• Equal volumes of water (10.0 cm3) are added to test tubes along with two pieces of magnesium ribbon of 2 cm long. Apparatus are arranged as in the diagram keeping all the factors identical except the concentration of an acid by adding 2 drops of a hydrochloric acid solution to one test tube and 4 drops of the same solution to the other.
• Gas bubbles evolve faster in the test tube containing acid in higher concentration.
• It can be concluded that concentration affects the rate of a reaction.
• Apparatus are set as shown in the diagram keeping all the factors identical except
temperature.
• It can be seen that the solution kept at higher temperature decolourizes faster.
• Therefore, temperature affects the rate of a reaction.
• To two test tubes separately add a lump of CaCO3 and CaCO3 powder of equal mass.
• To each test tube, add equal volumes of a HCl solution of the same concentration (e.g.0.01 mol dm-3)
• Keep both tubes in a water bath.
• Observe the difference in the rates of evolution of gas.
• Emphasize the need to immerse in a water bath.
• It can be observed that the tube containing CaCO3 powder effervesces faster.
• Thus, it can be concluded that the physical nature of reactants affects the rate of a reaction.
• Add 10.0 cm3 samples of ’20 volume’ H2O2 to two boiling tubes. (’20 volume’ means that unit volume of H2O2 solution gives twenty volumes of O2 at STP)
• Add 5.0 cm-3 of water to one tube and 5.0 cm3 of 0.1 mol dm-3 NaOH to the other.
• It is seen that gas bubbles evolve faster in the tube with NaOH.
• This leads to the conclusion that NaOH increases the rate of decomposition of H2O2.
(a) Homogeneous catalysts : If the catalyst and the reactants are in the same phase, they are called homogeneous catalysts.
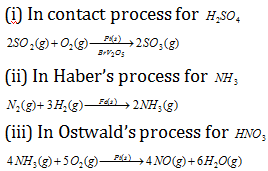
(b) Heterogeneous catalysts : If the catalyst and the reactants are in different phases, they are heterogeneous catalysts.


Consider a chemical reaction
aA + bB → cC + dD
rate with respect to the change of concentration of the reactant A = – Δ[A]/Δt
rate with respect to the change of concentration of the product D = Δ[D]/Δt
• In a given reaction, the rates of removal of each reactant and rates of formation of each products are not equal.
• The rate of removal of a reactant or formation of a product depends on the stoichiometric coefficients of the respective substances.
rate of reaction = – (1/a)Δ[A]/Δt = -(1/b)Δ[B]/Δt = (1/c)Δ[C]/Δt = (1/d)Δ[D]/Δt
• Rate law for the above generalized equation = k [A] x [B] y, where x and y are
order of reaction with respect to reactants A and B respectively.
• (x + y) of the above expression is referred as the overall order of the reaction.
Example
Express the rate of the reaction given, in terms of reactants and product concentrations.

The rate of the reaction is expressed as

Ammonia (NH3) gas decomposes over platinum catalyst to nitrogen gas (N2) and hydrogen gas (H2). The chemical reaction is as follows:
The reaction follows zero order kinetics. Therefore the rate law is rate r = k[NH3]o
For a zero order reaction the concentration versus time profile is linear and the rate of reaction versus time has the profile.

Rate of reaction versus time for a zero order reaction

Cyclopropane (C3H6) at room temperature has a ring structure. When it is heated, the ring opens up and cyclopropane isomerizes to propylene.
The reaction takes place in a first order manner. Therefore, the rate law for the reaction is, rate (r) = k [C3H6]1

The above figure is an example of the first order reaction. The rate of the reaction depends on the concentration of the reactant. Initially the rate is fast and then it slows down as the concentration of the reactant falls.
Nitrogen dioxide (NO2) gas reacts with fluorine gas (F2) to give nitrosyl fluoride. The chemical reaction is given by the equation.

The reaction has the rate law as:
rate (r) = k [NO2] [F2]
The rate has order one with respect to nitrogen dioxide concentration and fluorine concentration and the overall order is (1 + 1) which is two.
This depicts the change of concentration of second order reaction with only one reactant, that is, a reaction of the type A  P where the rate law is rate r = k [A]2.
Requirements : 250 cm3 of 0.1 mol dm-3 H2SO4 , Six pieces of 2.0 cm cleaned magnesium ribbon.
Method
Mg(s) + H2SO4(aq) → MgSO4(aq) + H2(g)
• Into a boiling tube, 10.0 cm3 of water is added and marked with a rubber band.
• Into the same boiling tube, 40.0 cm3 of 0.1 mol dm-3 H2SO4 is added and filled with water brimfully.
• The cleaned magnesium ribbon is fixed as shown in the diagram to the bung, the tube is closed with the bung and turned upside down while switching on the stop watch simultaneously.
• Time taken by the gas to fill up to the level of the rubber band is measured.
• Measurement of time is repeated for different solutions tabulated below, every time
fixing a fresh Mg ribbon.
•Calculate the concentration of each acid solution and plot a graph between [H+] and 1/t.
R ∝ [H+]n
Initial rate = Average rate for a small change from the starting point
= Volume of gas produced/Time = Constant/Time = k/t
R ∝ 1/t
[H+]n ∝ 1/t
Requirements : 0.10 mol dm-3 Na2S2O3 solution. 2.0 mol dm-3 HCl solution, stop
watch, boiling tubes, measuring cylinders, 50 cm3 beaker.
S2O32-(aq) + 2H+(aq) → S(s) + SO2(g) + H2O(l)
Method
• Given volume of Na2S2O3 solution as shown in the table is added to a 50 cm3 beaker.
• The beaker containing the Na2S2O3 solution is kept on a white paper marked with a cross. Relevant volume of the HCl solution is added and the time to disappear the cross is measured keeping the eye at a constant height from the beaker.
• The beaker is cleaned and the experiment is repeated mixing the solutions given in the table below.
(i) Determining the relationship between the reaction rate and the thiosulphate ion concentration.
The experiment is done using thiosulphate solutions of different concentrations as given in the table.
R ∝ [S2O32-(aq)]n
(ii) Determining the relationship between the reaction rate and the concentration of hydrogen ions.
The experiment is done using acid solutions of different concentrations as given in the
table.
R ∝ [H+]n
In both the above instances, assume that the rate is constant during the period of measurement of time taken to disappear cross and it is equal to the initial rate. Then, Rate = constant / t
In both instances examine how concentration varies with 1/t.
2Fe3+(aq) + 2I–(aq) → I2(aq) + 3Fe2+(aq)
The amount of I2 produced can be used to determine the rate of this reaction. The
minimum iodine concentration required to turn starch blue is 1.0×10⁻⁵ mol dm-3. Since this is very small, measuring time is difficult. Therefore, time taken to appear blue colour should be delayed to measure the time. This can be affected through a faster reaction which converts I2 to I–. For this Na2S2O3 can be used.
2S2O32-(aq) + I2(aq) → S4O2-(aq) + 2I–(aq)
A known amount of Na2S2O3 is added to the medium. The moment in which Na2S2O3 is over, the solution turns blue. The amount of I2 formed depends on the amount of Na2S2O3 added
Requirements :
0.10 mol dm-3 KI solution, 0.10 mol dm-3 FeCl3 or Fe(NH4)(SO4)2 solution,
0.10 mol dm-3 Na2S2O3 solution, 0.10 mol dm-3 H2SO4 solution, stopwatch
Mix the solutions given in the above table as shown here. Measure the time taken to turn the solution blue.
In both instances examine how rate (1/t) varies with concentration.

According to the shape of the graph, order of the reaction (n) can be determined.
We calculate the average rate of a reaction over a time interval by dividing the change in concentration over that time period by the time interval. For the change in concentration of a reactant, the equation, where the brackets mean “concentration of”, is
An instantaneous rate is the rate at some instant in time. An instantaneous rate is a differential rate: -d[reactant]/dt or d[product]/dt.
We determine an instantaneous rate at time t:
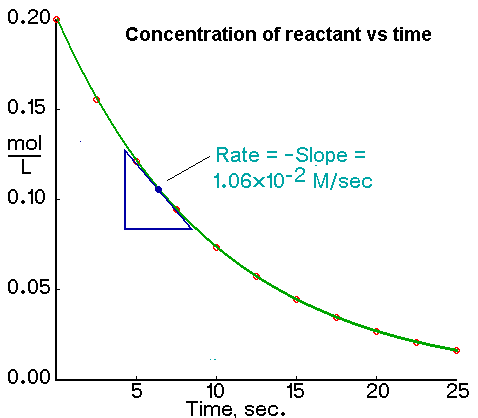
The initial rate of a reaction is the instantaneous rate at the start of the reaction (i.e., when t = 0). The initial rate is equal to the negative of the slope of the curve of reactant concentration versus time at t = 0.
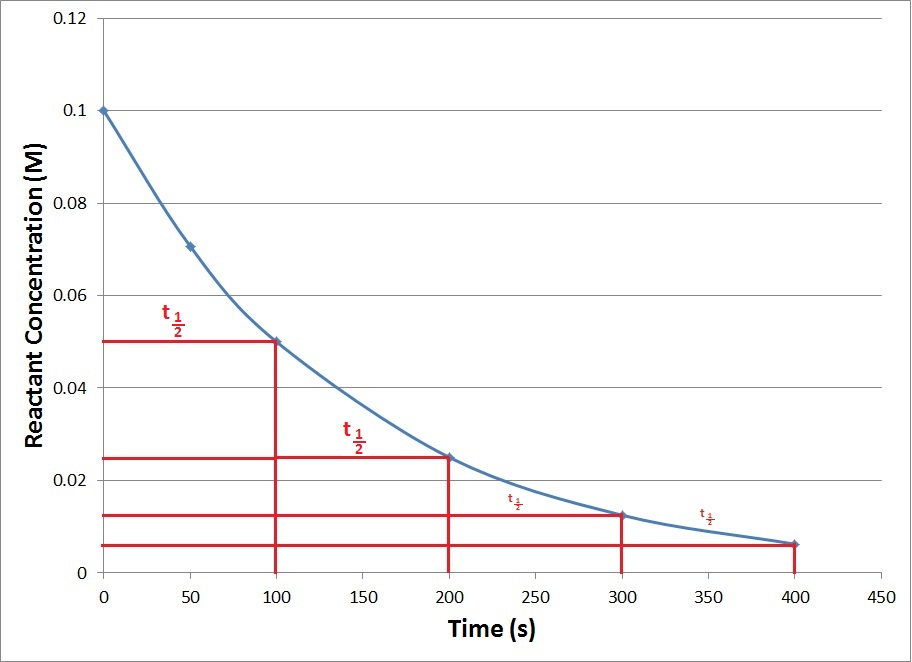
Half life of a reaction is defined as the time required for reducing the concentration of a reactant to half its initial value. It is denoted as t1/2.
The t1/2 of a zero order reaction is given as

while for the first order reaction it is given as

Only for the first order reaction t1/2 is independent of the initial concentration of the reactant. This relation can be used to determine the order of a reaction.
Elementary reactions are classified according to their molecularity. The number of reacting species, which are involved in simultaneous collision to bring about a chemical reaction is called the molecularity of the reaction. In a unimolecular reaction, a single molecule shakes itself apart or its atoms into a new arrangement.
Example
Decomposition of NH4NO2 to N2 and 2 H2O

Bimolecular reactions involve the collision of pair of molecules. Bimolecular reactions are common.
Example :
Oxidation of nitric oxide by ozone

Intermolecular reactions, three molecules collide simultaneously. Such reactions are rare.

Molecularity is defined for elementary reactions where as order corresponds to the overall reaction. The overall reaction might involve one elementary reaction or it might involve a sequence of elementary reactions (a sequence of elementary reactions denotes a complex reaction).
The rate determining step
The overall rate of a reaction (the one which you would measure if you did some experiments) is controlled by the rate of the slowest step. In the example above, the hydroxide ion can’t combine with the positive ion until that positive ion has been formed. The second step is in a sense waiting around for the first slow step to happen.
The slow step of a reaction is known as the rate determining step.
As long as there is a lot of difference between the rates of the various steps, when you measure the rate of a reaction, you are actually measuring the rate of the rate determining step.
Example


By doing rate of reaction experiments, you find this rate equation:
![]()
![]()
The reaction is first order with respect to the organic compound, and zero order with respect to the hydroxide ions. The concentration of the hydroxide ions isn’t affecting the overall rate of the reaction.
If the hydroxide ions were taking part in the slow step of the reaction, increasing their concentration would speed the reaction up. Since their concentration doesn’t seem to matter, they must be taking part in a later fast step.
Increasing the concentration of the hydroxide ions will speed up the fast step, but that won’t have a noticeable effect on the overall rate of the reaction. That is governed by the speed of the slow step.
This is much easier to talk about with a real example. The equation below shows an organic chemistry reaction in which a bromine atom is being replaced by an OH group in an organic compound. The starting compound is bromoethane, and the organic product is ethanol.
![]()
![]()
During the reaction one of the lone pairs of electrons on the negatively charged oxygen in the -OH group is attracted to the carbon atom with the bromine attached.
That’s because the bromine is more electronegative than carbon, and so the electron pair in the C-Br bond is slightly closer to the bromine. The carbon atom becomes slightly positively charged and the bromine slightly negative.

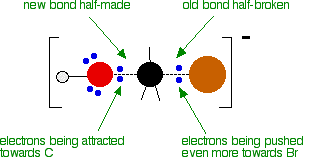
As the hydroxide ion approaches the slightly positive carbon, a new bond starts to be set up between the oxygen and the carbon. At the same time, the bond between the carbon and bromine starts to break as the electrons in the bond are repelled towards the bromine.
At some point, the process is exactly half complete. The carbon atom now has the oxygen half-attached, the bromine half-attached, and the three other groups still there, of course.
And then the process completes:
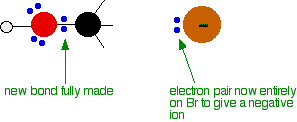
The second diagram where the bonds are half-made and half-broken is called the transition state, and it is at this point that the energy of the system is at its maximum. This is what is at the top of the activation energy barrier.
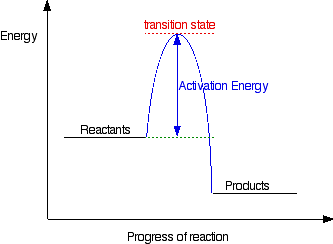
But the transition state is entirely unstable. Any tiny change in either direction will send it either forward to make the products or back to the reactants again. Neither is there anything special about a transition state except that it has this maximum energy. You can’t isolate it, even for a very short time.
For reasons which you may well meet in the organic chemistry part of your course, a different organic bromine-containing compound reacts with hydroxide ions in an entirely different way.
In this case, the organic compound ionises slightly in a slow reaction to produce an intermediate positive organic ion. This then goes on to react very rapidly with hydroxide ions.


The big difference in this case is that the positively charged organic ion can actually be detected in the mixture. It is very unstable, and soon reacts with a hydroxide ion (or picks up its bromide ion again). But, for however short a time, it does have a real presence in the system. That shows itself in the energy profile.
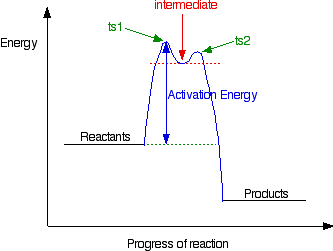
The stability (however temporary and slight) of the intermediate is shown by the fact that there are small activation barriers to its conversion either into the products or back into the reactants again.
Notice that the barrier on the product side of the intermediate is lower than that on the reactant side. That means that there is a greater chance of it finding the extra bit of energy to convert into products. It would need a greater amount of energy to convert back to the reactants again.
These peaks are labelled “ts1” and “ts2” – they both represent transition states between the intermediate and either the reactants or the products. During either conversion, there will be some arrangement of the atoms which causes an energy maximum .
• For a reaction to take place;
– the reacting molecules should collide.
– the colliding molecules should have a proper orientation.
– the reacting molecules should have kinetic energy greater than or equal to certain minimum value. This minimum value of energy is called activation energy.
Consider a simple reaction involving a collision between two molecules – ethene, CH2=CH2, and hydrogen chloride, HCl, for example. These react to give chloroethane.
![]()
![]()
As a result of the collision between the two molecules, the double bond between the two carbons is converted into a single bond. A hydrogen atom gets attached to one of the carbons and a chlorine atom to the other.
The reaction can only happen if the hydrogen end of the H-Cl bond approaches the carbon-carbon double bond. Any other collision between the two molecules doesn’t work. The two simply bounce off each other.
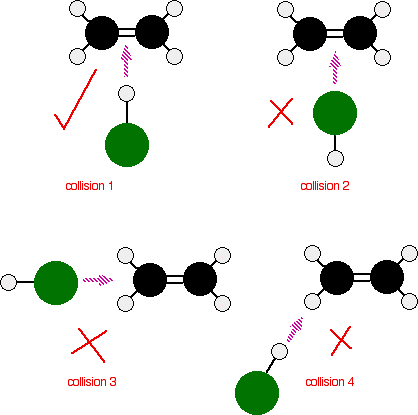
Of the collisions shown in the diagram, only collision 1 may possibly lead on to a reaction.
collision 2 won’t work as well. The double bond has a high concentration of negative charge around it due to the electrons in the bonds. The approaching chlorine atom is also slightly negative because it is more electronegative than hydrogen. The repulsion simply causes the molecules to bounce off each other.
Even if the species are orientated properly, you still won’t get a reaction unless the particles collide with a certain minimum energy called the activation energy of the reaction.
Activation energy is the minimum energy required before a reaction can occur. You can show this on an energy profile for the reaction. For a simple over-all exothermic reaction, the energy profile looks like this:
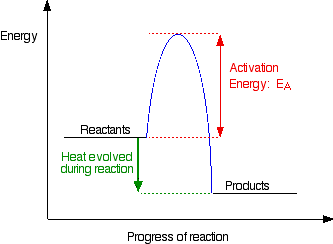
If the particles collide with less energy than the activation energy, nothing important happens. They bounce apart. You can think of the activation energy as a barrier to the reaction. Only those collisions which have energies equal to or greater than the activation energy result in a reaction.
Any chemical reaction results in the breaking of some bonds (needing energy) and the making of new ones (releasing energy). Obviously some bonds have to be broken before new ones can be made. Activation energy is involved in breaking some of the original bonds.
Where collisions are relatively gentle, there isn’t enough energy available to start the bond-breaking process, and so the particles don’t react.
• The rate of reaction depends on the activation energy (Ea). When Ea decreases, the number of molecules which have higher energy than Ea, increases. So, the number of effective collisions increases and the rate is increased.
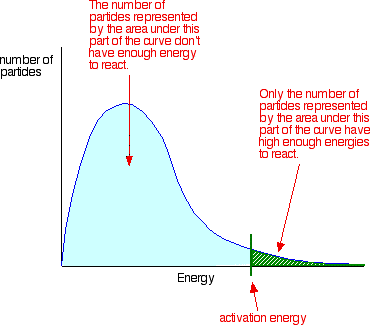
Notice that the large majority of the particles don’t have enough energy to react when they collide. To enable them to react we either have to change the shape of the curve, or move the activation energy further to the left.
When temperature increases, the kinetic energy and the number of collisions per unit time and per unit volume also increase. Hence, the number of effective collisions per unit time also increases. Thus the rate of reaction increases. The fraction of molecules having energy greater than the activation energy increases rapidly in most reactions even with a small increase in temperature. This can be explained by the Maxwell -Boltzmann energy distribution graphs.
the graph labelled T is at the original temperature. The graph labelled T+t is at a higher temperature.
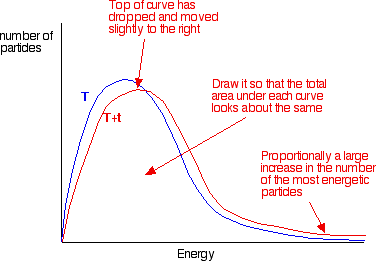
If you now mark the position of the activation energy, you can see that although the curve hasn’t moved very much overall, there has been such a large increase in the number of the very energetic particles that many more now collide with enough energy to react.
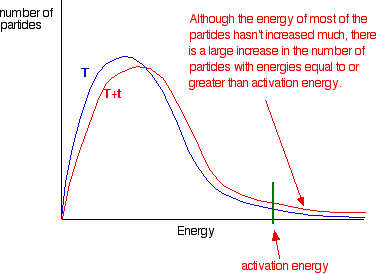
The area under a curve gives a count of the number of particles. On the last diagram, the area under the higher temperature curve to the right of the activation energy looks to have at least doubled – therefore at least doubling the rate of the reaction.
When the concentration of the reactants increases the number of molecules per unit volume increases. Hence, the number of effective collisions per unit volume and per unit time also increases. So, the rate of reaction increases.
Note-In gaseous reactions, when the pressure increases at a constant temperature, the volume decreases. So the concentration increases. In gaseous reactions, the rate of reaction increases with the increasing pressure.
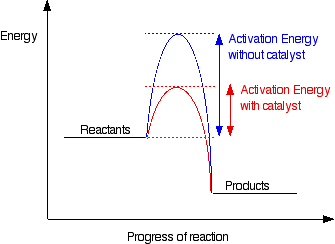
To increase the rate of a reaction you need to increase the number of successful collisions. One possible way of doing this is to provide an alternative way for the reaction to happen which has a lower activation energy.
In other words, to move the activation energy on the graph like this:
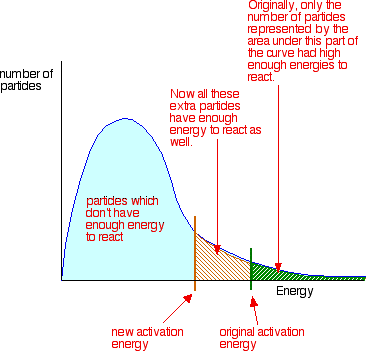
Adding a catalyst has exactly this effect on activation energy. A catalyst provides an alternative route for the reaction. That alternative route has a lower activation energy. Showing this on an energy profile:
The smaller the size of solid reactant particles, the greater the surface area with which the reacting molecules can collide. This increases the reaction rate.
e.g. Powdered CaCO3 reacts faster than lumps of CaCO3 with a solution of HCl.