Positive relationship between price and quantity supply is the law of supply.
law of supply can be expressed in three ways.
- Supply schedule
- Supply curve
- Supply equation
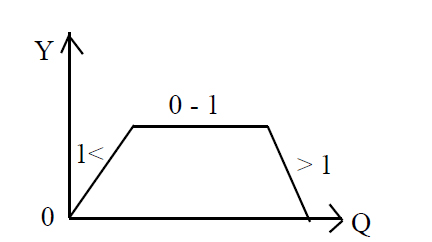
- The supply curve has a positive slope according to the law of supply.
- The supply equation has a positive relationship
- The positive slope of the supply equation can be illustrated with following equation
- The reason for the positive relationship between the price quantity supply or the law of supply the
- is law of increasing opportunity cost.
- The total of each individual suppliers in the market is explained as market supply.
The opportunity cost of all economic resources forgone for a particular production process can be identified as production cost.
- In economics, opportunity cost is considered as production cost which it includes both
direct and indirect costs.
- In accounting, only direct costs will be considered.
- Indirect cost/ assumed cost means, earnings of factors forgone to employ the
production resources of a production firm for their production process.
- The opportunity cost of all economic resources forgone for a particular production
process can be identified as production cost.
- In economics, opportunity cost is considered as production cost which it includes both
direct and indirect costs.
- In accounting, only direct costs will be considered.
- Indirect cost/ assumed cost means, earnings of factors forgone to empty the
production resources of a production firm for their production process.
- The minimum benefit expected by an entrepreneur to remain in the production process is
considered as normal profits. Also it is considered as the opportunity cost of the
production factor of the entrepreneur.
- Expenditure borne by a production personally for the inputs of the production process is
identified as private costs and expenditure borne by independent external parties as a
result of the production process is identified as external costs.
If a good or a service is supplied to the market, it implies the following facts.
- Institutes owns technology and other resources for production
- Institute can earn profits when producing goods
- There is a plan to produce and market the good.
- Supply of a good to the market by one firm is said to be institutional supply and the total of all firms is market supply.
The following factors determine a firm’s supply
- Price of goods concerned. (P)
- Price of inputs (C)
- Technology. (T)
- Price of related goods (Pn)
- Expectations of producers (En)
- Government policies (G)
- Other factors.(O)
- Except these factors the number of producers in the market also affects
supply.(N)
Supply function can be illustrated with all these factors as follows.
QS = f {P, C, T, Pn, Ex, N, G,O}
Qs is dependent factors and all other factors are independent factors
The relationship between all determinents and supply is explained as the theory of supply.
- Firm is a unit that produces products using economic resources
- Technological relationship between inputs and outputs is described by the production function
Production function is summarized by the following equation
Q = F ( L, K)
Q = output
F = Function
L = Labour ( Variable factor inputs)
K = Capital (Fixed factor inputs)
- Variable factor inputs and fixed factor inputs exist in the short run production
- All factor inputs are variable in the long run.
- Short run and long run are determined by the nature of production
- Short run production behaviour is characterized by the law of diminishing marginal returns
- Short run production is governed by the law of diminishing marginal returns
- Diminishing marginal returns states that when production is increased by increasing variable
factor input for a given amount of fixed factor input, the average and marginal product of
the variable factor will diminish after a point
The table below illustrates the law of diminishing marginal returns
![Untitled-tr]()
- Marginal product is zero when the total product is maximized
- Marginal product curve slopes downward through the maximum point of the
average product curve
- Returns to scale explains long run production behaviour when all factors are
variable
There are three types of returns to scale
- Increasing returns to scale
- Decreasing returns to scale
- Constant returns to scale
- Increasing returns to scale prevails when output is increased by a greater
percentage than the increase in all inputs in the long run production
- Decreasing returns to scale exists when output is increased by a less percentage
than the increase in all inputs in the long run production
- Constant returns to scale exists when output is increased by the same percentage
to the increase in all inputs in the long run production
- Increasing returns are the result of economies of scale
- Increasing returns are caused by the geometric nature of certain inputs, indivisibility
of factors of production, use of machinery, division of labour and specialization
of labour, and one time payment
- Diseconomies of scale causes decreasing returns to scale
- Decreasing returns to scale are caused by depletion of resources, stress and,
problems of management and coordination
Responsiveness of change in quantity demand to a change in income is explained as income elasticity of demand.
- Relationship between income and demand varies
- Responsiveness of change in quantity demand to a change in income can be
calculated using the following formula
Yed = Percentage in quantity demad of good /Percentage change in income
Yed = { (ΔQd/ΔY) X (Y/Q) }
Goods can be classified according to income elasticity of demand.
- Normal goods Luxury goods
- Essential goods
- Inferior goods
- Income elasticity of demand is positive in normal goods, and less than one.
- Income elasticity of demand more than one is luxury goods.
- If income elasticity of demand is less than one, these goods are said to be essential
goods.
- Demand for essential goods, sometimes does not change / remain constant ; if
income is changed.
- When income increases , demand for inferior goods decreases and income elasticity
is negative.
- This relationship can be illustrated with the following graph
![Untitled-3MU]() Determinants of income elasticity of demand can be explained as
Determinants of income elasticity of demand can be explained as- Nature of goods, income group of consumer and etc.
Practical importance of income elasticity of demand can be explained as, follows
- Goods can be classifies with income elasticity of demand.
- Income gap of people can be identified.
Responsiveness of a change in quantity demand of other good to a change in price of the good concerned is explained as cross elasticity of demand.
Cross elasticity of demand can be computed as follows
- Cross elasticity of demand = Percentage change in quantity demand of good X / Percentage change in price of good Y
(Exy = ΔQDX% / ΔPY% )
- When cross price elasticity is calculated , the answer is explained as coefficient of cross price elasticity of demand.
Goods can be classified according to the coefficient of cross price elasticity of demand as
- Substitutes
- Complementary goods
- If there is a positive slope of the demand curve which is drawn with substitute goods
- If there is a negative relation ship between the price of one good to the quantity of other good, then the goods are said to be complements.
- There is a negative slope of the demand curve which is drawn with complementary goods.
- If the cross elasticity of demand is zero that means there is no relationship between the two goods.( Unrelated goods)
- Cross elasticity of demand can be used practically as follows,
- To realize interrelationship between two goods.
- To recognize the quantity of production function to compiling economic policies.
Elasticity is responsiveness of change in dependent variable relative to independent variable
- Price elasticity of demand is the responsiveness to change in quantity demanded
relative to change in price
Price elasticity can be calculated as follows
Price elasticity = Precentage change in quantity demand / Precentage change in price (ΔQD% /ΔP%)
- Elasticity can be calculated under point elasticity formula and arc elasticity formula
- Point elasticity formula estimates the elasticity of given point considering small change in price and quantity
- In point elasticity formula, percentage change of price and quantity are calculated relative to initial price and quantity
- Even though the slope is constant, quantity and price change from point to point. Elasticity of a linear demand curve that slopes from left to right changes from point to point. Elasticity varies from zero to infinity
Following are three specific situations that have a constant elasticity coefficients throughout the demand curve,
- Perfect elastic demand
- Perfect inelastic demand
- Unitary elastic demand
- Arc elasticity formula can be used to calculate the elasticity of a range
- Arc elasticity formula considers a big change in price and quantity
- In point elasticity formula, percentage change of price and quantity are calculated relative to mean or average value previously and now.
Types of elasticity which derived according to the elasticity formula can be shown below
- Zero(0)- Perfect inelastic
- Less than one(<1)-inelastic
- Equal to one (1)-unitary
- More than one(>1)-elastic
- Infinity perfect elastic
- There is a relationship between price elasticity and consumer outlay/ producer revenue
- Since demand function contains the inverse of the slope, elasticity also can be calculated through it.
The consumer outlay can be calculated through multiplying the quantity demanded by the price.
- The producer revenue can be calculated through multiplying the quantity sold by the price.
- Due to quantity sold being equal to the quantity purchased, production revenue is equal to consumer outlay.
When the price is changed, the consumer outlay is changed according to the type of price elasticity.
- There is a positive relationship between change in price of a inelastic good and
change in consumer outlay
- When the price increases, the consumer outlay increases.
- When the price decreases, the consumer outlay decreases.
- If the demand of a commodity is unitary, the consumer outlay could not be changed
when the price of the commodity is changed.
- It would be an inverse relationship between the change in price of a good and
change in consumer outlay , if the demand for a commodity is elastic.
- When the price increases the consumer outlay decreases.
- When price decreases the consumer outlay is increases.
- Various reasons affect to determine price elasticity of demand.
The reasons that affect change of price elasticity of demand is defined as determinants of price elasticity and these are mentioned below.
- Availability of substitutes for a good
- Income which is spent on the good
- Definition of the good
- Benefits of the good
- Luxuries and Necessities
- Time period needed to adjust the price changes.
- The contemporary social, political, economic and cultural changes takes place domestically and globally affects a country’s economy.
- These contemporary economic events are mainly categorized as domestic and global.
Global contemporary Economic events
- Global contemporary economic events affect Sri Lankan economy in favourable and unfavouarable way and it can be explained with an example below:
- Increase in prices of crude oil in foreign market affected Sri Lankan economy in an unfavourable way by increasing prices here.
Domestic contemporary Economic events
- Domestic contemporary economic events affect Sri Lankan economy in favourable and unfavouarable way and it can be explained with an example below:
- Tsunami disaster affected development of Sri Lankan economy in an unfavourable way by destroying of infrastructure, industries, human lives and property in coastal areas.
- Total resource in Sri Lanka comprises with stock of the country is constituted by Gross Domestic Product and with imports of goods and services.
- After independence, the total resources of Sri Lanka have changed during different t time following the changes in Gross Domestic Product and import structure.
- Economic policies and new strategies were used to increase the Gross Domestic Product and then to increase the total amount of resources.
- Sri Lanka’s total resource utilization comprises consumption, investment and exports of goods and services.
- Sri Lanka’s national savings constitute domestic and foreign savings.
- Where domestic savings constitute public and private savings.
- Foreign savings constitute net foreign factor income and net foreign private transfers.
- To improve a country’s national savings the net foreign private transfers should improve.
- Improving domestic savings and foreign savings leads to increase investments which contributes greatly to economic growth.
Most important periods related to economic growth After independence
- The period of 1948 to 1977
- The period after 1977
- Relative to other sectors, service sector contribution towards economic development process shows a progress.
- Service sector contribution which remained at 34% in1950 has grown up to 46% in 1977 and further grown up to 50% during 1991-2000 decade and recorded a value of 57.7% in2009.
- Service sector is expanding further within economy.
Importance of expanding the Services sector
- When a country is moving towards a fast economic growth the elasticity of demand for services will takes a value of greater than one which would leads to services sector progress.
- Service sector expansion is important for a small country like Sri Lanka, as the natural resources required for services remain at a very low level comparing to other sectors.
- As a result of protecting natural capital includes in the concept of sustainable development the expansion of services sector takes place within globalization process which will leads to achieve high benefits.
- Services sector records a high productivity relative to agricultural and industrial sectors.
- It is important in generating income sources for increasing population.
- As the most efficient sector, the contribution of services sector is important to generate assets on agricultural and industrial sector.
- Services sector helps in expanding choices of public by coordinating the fields of production, distribution and consumption.

 Determinants of income elasticity of demand can be explained as