Expenditure on final consumer goods like food, clothes etc and services by households is explained as private consumption expenditure.
Gross investment can be classified as
- Gross domestic fixed capital formation
- Change in stocks ( Inventories)
• Government purchases are the expenditures on goods and services by the government.
• Net exports is the difference between exports and imports.
• value of gross domestic expenditure comprises private consumption, gross
investment and government purchases.
• Expenditure on gross domestic production can be calculated by adjusting net exports
to gross domestic expenditure.
• Expenditure on Gross National Production can be calculated by adjusting Net Foreign
Factor Income to Expenditure on Gross Domestic Productions
The following types of expenditure are excluded by considering only effective economic activities
- Transfer payments
- Transactions of resale of goods
- Expenditure on intermediate goods
- Expenditure on financial papers.
Structure of resources can be explained as
Total resources = Gross domestic production + goods and non factor services imports.
Utilization of resources can be explained as
Utilization resources = Private consumption + Government consumption + Gross domestic capital formation + Goods and Non factors services exports.
(Explain using related data in Sri Lanka)
Data on National accounts are essential for economic management.
• Gross Domestic production comprises three sectors agriculture, Industry and
services.
• The importance of economic structural changes with relative contribution
of economic sector to gross domestic production, can be analyzed..
• Considering the structure of gross domestic production, economic policies can be
implemented to uplift the relevant economic sectors.
• National income accounts can be used to illustrate the distribution of income among
factors of production.
• This shows the percentages of incomes distributed to labour and property
assures.
• National accounts can be used to evaluate the economic condition of a country and
international comparison.
• Per capita income is computed with the ratio between National income / production
and mid year population of the country.
National Income / production
Per-capita Income = ___________________________
Midyear population
-116-
• Economic growth is explained as the continuous increase in real national out put.
• Economic growth can be measured with the gross National production at constant
prices .
• The following limitations can be seen when preparing the National income accounting
data.
• Transaction of non market activities
• Illegal economic activities
• Informal economic activities
• Increase in quality of production
• Non-consideration of the influence of the environment.
• Excluding the interest payments on government debt.
• Transaction of non market activities are
•Household services in a household.
•Services of self employment.
•Subsistence economic activities
• National production is under estimated as non-inclusion of the above effective
economic activities.
• Examples of illegal economic activities are
• Illegal production and sales of liquor, prostitution, bribery and corruption military
and insurgent activities.
• Through income and expenditure flows occur in all these activities, the value of
National production is underestimated because they are not included.
-117-
• Informal economic activities are explained as the activities performed by poor
people and are not recognized by the government
• characteristics of informal economic activities areas are as follows.
• Informal documentation
• Depends on family labour.
• Failure to count for tax payments and social security contributions.
• Failure to conform to various government rules and regulations
• Production values derived from the above economic activities are not officially
reported,therefore, National accounts are under estimated.
• When calculating National accounts only quantity is considered but not increase in
quality.
• Unfavorable influence on the environment when the production process is explained as
environmental deviation.
• Because of these unfavorable influences to welfare are not included, National income
is overestimated.
• Considering these effects of environment national accounts are adjusted are called
green national accounts.
National income can be computed in income approach by adding all factor of incomein production process.
Factor incomes in production process.
Factor incomes can be classified under five categories.
- Income of employment
- Real income
- Net interest
- Profit and entrepreneur’s income
- Self employment and professional income.
Employed income is based on three factors
- Salaries and wages
- Employers’ payments for social security contributions.
- Insurance services, health facilities, labour compensations and disaster payments to
employees.
Rent income is based on the following
- Rent income earned from fixed property and rent from internal resources which are
given on lease or rent.
- Rent from houses and implicit rent
- Income on intellectual property
Only net interest of the business sector is included in National income estimates
Profit and entrepreneurs’ income are based on the following sources.
- Corporate income taxes
- Dividends given to owners.
- Undivided profits
Self employed and professional income include the following.
- Sole enterprises which are not registered as companies.
- Partnerships and cooperatives .
- Farmers’
- Various professionals employed in other jobs
- Professionals (Doctors, Lawyers)
- Private incomes
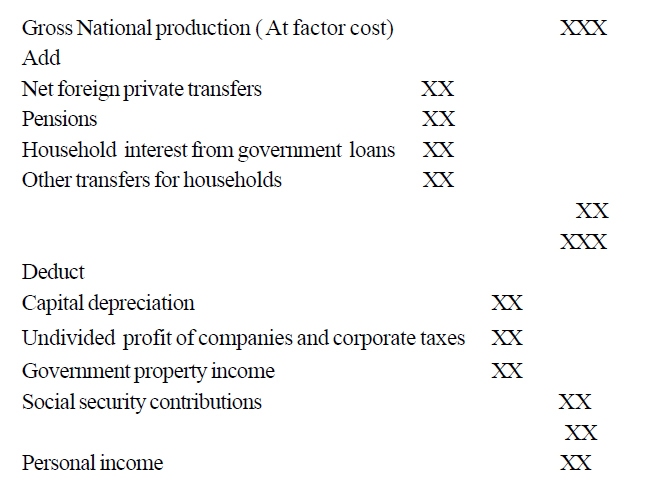
Household income can be calculated as follows
![Untitled-1try]()
Disposable personal income occurs when direct taxes are deducted from personal income.
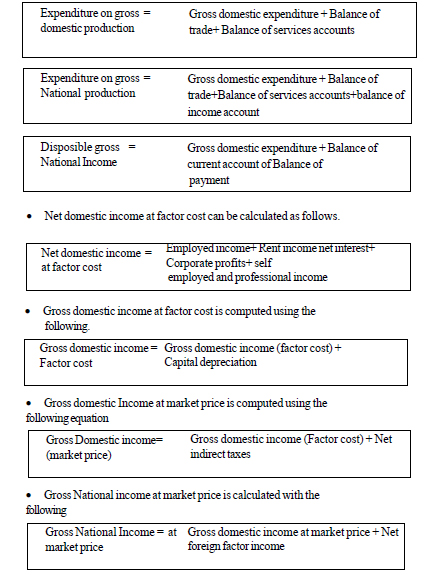
The following schedule illustrates how foreign accounts are related to National accounts.
![Untitled-1uu]()
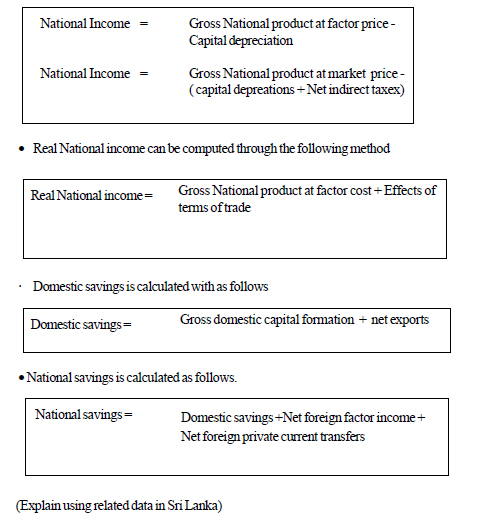
National income can be computed in two ways
![ggf]()
- Gross Domestic Production is the value of final productions, produced in a geographical region in a certain year.
- The total of value added in agriculture, Industrial sector and services is Gross Domestic Production.
- The total value of output which is manufactured by the national resources , in a given period of time is Gross National Production.
- Gross National Production can be calculated by adjusting receipts and payments of foreign factor income to Gross Domestic Production.
- The difference between receipts and payments of foreign factor incomes is namednet foreign factor income.
- Net Domestic Production is the difference between gross domestic production and capital consumption (Depreciation)
- Net National Productions is derived by deducting capital consumption from gross national production
- Exceptional characteristic of Net National Production is that it includes only the income of factors services.
- National income is calculated by adjusting net indirect taxes to net National Production.
- Value of the productions is based on payments of all factors or cost of production is explained as factor cost price.
- When net indirect taxes are adjusted to factor cost price, Gross Domestic Production at market price occurs.
- Gross National Production at market price is explained as the current price or present price of gross National production.
- Gross National Production at current price does not show the real increase of the economy.
- To understand the changes of real production the Gross Production should be adjusted for the price inflation.
- If the value of production at current prices is deflated by a price index, the value of the production at constant price is derived.
- Gross Domestic Production at constant price is termed real Gross Domestic Productions
- By comparing the Gross Domestic / National Production at the current price with Gross Domestic / National Production at constant price, implicit price index occurs.
- Implicit price index or deflator of national production can be computed as follows.
Implicit price index = ( G.D.P. at current price /G.D.P. at constant price) x 100
Estimating National production based on Output flow, is named output approach.
When calculating national accounts with output approach, multiple counting can occur.
To avoid multiple counting, two methods can be used.
- Final product method.
- Value added method.
- Final product method includes only the final values of consumer goods , Investment
goods and services.
- The total of value added of all sectors as agriculture, industry and services is termed
Gross Domestic Production.
- Value added can be calculated with the difference between total value and inputs.
- Value added is explained as all new values which are added to the production process
at different times.
- It includes, the payments for factor services, net indirect taxes and depreciation
Income is generated through the production process and that income will be spent to purchase goods and services.
The components of aggregate expenditure are as follows
- Private consumption
- Government consumption expenditure
- Investment expenditure
- Net export
The consumption expenditure depends on the disposable income. C = f (Yd)
Private consumption expenditure comprises
- Buying durable consumer goods
- Buying non durable consumer goods
- Buying services
The expenditure on capital goods is, investment expenditure .Example: Machinery, tools, housing and etc.
Government expenditure spent to purchase goods and services from private sector to provide various economic activities.
Example:
- Provide public goods
- Provide merit goods
- National security
- Government administrative cost
The difference between export revenue and import expenditure is net exports
This net export can be either negative or positive.
The determinants of private consumption can be shown as follows.
- Disposable income
- The wealth of households
- Levy of taxes by the government
- Loans of households
- The determinants of investment expenditure are; as follows Demand for goods produced through new investments.
- Changes of interest rates and corporate taxes.Business expectations
The factors of determining the government consumptions expenditure are as follows
- Usage of public goods
- The expenditure on welfare goods
- The expenditure on public administration
Aggregate income (Y) and aggregate expenditure (E) are equal in macroeconomic equilibrium.
This can be illustrated through two approaches.
- Withdrawers and injection approach
- Income and expenditure approach
- Income and expenditure approach illustrates the equilibrium in a simple economy as,
Aggregate income= Aggregate expenditure Y = E
- In a simple economy the determinants of aggregate expenditure (E) are Private consumption expenditure and investment expenditure
- It can be illustrated with the following equation E= C+I
Aggregate income is utilized for consumption expenditure and savings in a simple economy
It can be illustrated with the following equation. Y = C+S
With withdrawers and injections approach, the equilibrium in a simple economy can be
illustrated as follows
Y = C+S
E = C+I
Y = E
C+S = C+I
S = I
Savings are withdrawers (W) and investments as the injections (J). Therefore with- drawals and injections are equal in the equilibrium.
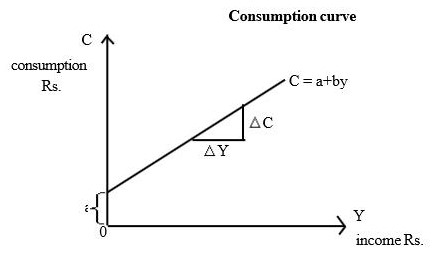
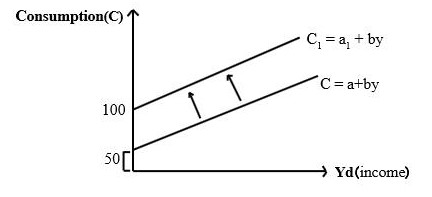
The consumption function can be illustrated as follows.
C = a+byd C = Consumption
a = autonomous consumption
b = Marginal propensity to consume
y = Disposable income
Autonomous consumption is determinants independent of current income.
Marginal propensity to consume shows the fraction of change income which is
consumed.
It can be calculated as follows
MPC = ΔC/ΔY
b = Marginal propensity to consume (MPC)
Δc = Change in consumption
Δy = Change in income
The consumption function can be illustrated with a graph.
![rg4y (2)]()
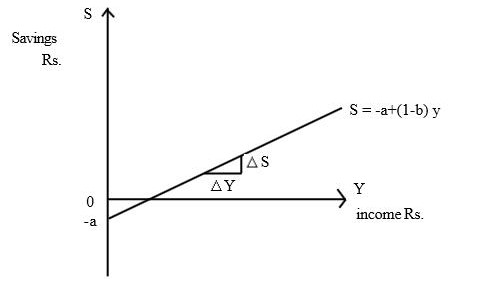
Saving function also can be illustrated as
S = -a + (1-b) yd
S = Savings
a = autonomous savings
(1-b) = Marginal propensity to save (MPS)
Marginal propensity to save shows that a fraction of change in income which is saved. It can be calculated as
MPS = ΔS/ΔY
ΔS = Change in savings
ΔY = Change in income
MPS = Marginal propensity to save
Saving function also can be illustrated graphically.
![tyr (2)]()
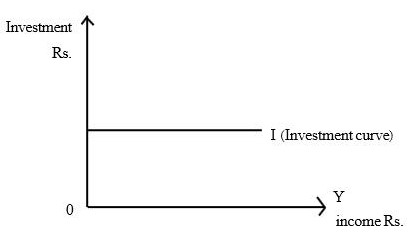
Assuming that though the income is changed, the investment is constant in a simple
economy According it, the investment can be shown as
![hjft (2)]()
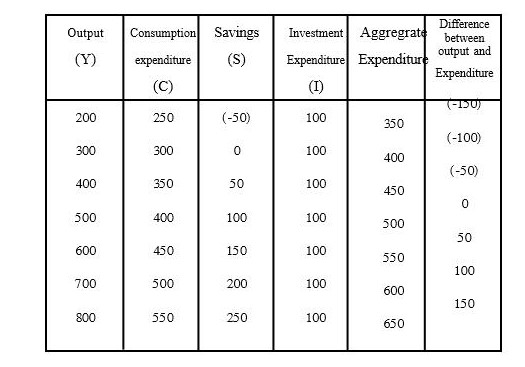
Equilibrium in a simple economy can be computed with,
- a schedule
- graphical presentation
- Equations
Equilibrium can be calculated with a schedule in a simple economy
![tyurty (2)]()
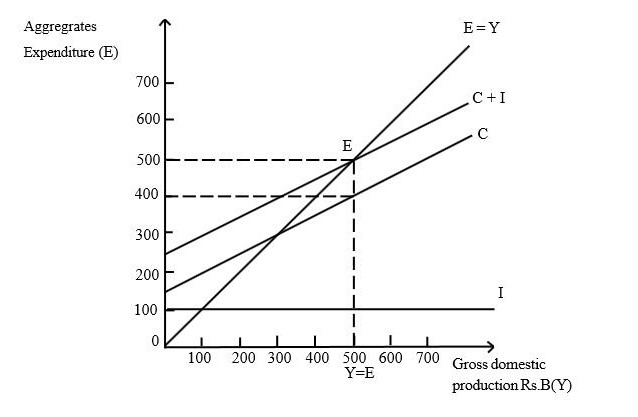
The equilibrium of a simple economy can be computed graphically
![u (2)]()
According to the diagram, national Income is illustrated with the point E.
The equilibrium in a simple economy can be calculated with the graph and equations
also.
Change in equilibrium in a simple economy depends on the following components.
- Change in consumption function.
- Change in investment.
Change in consumption function depends on two factors.
- Change in autonomous consumption
- Change in Marginal Propensity to consume (M.P.C)
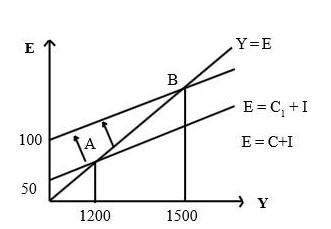
Change in consumption function can be illustrated with the change in autonomous consumption.
![rt (2)]()
![rt (3)]()
According to the above diagram, the consumption function has changed due to the change in autonomous consumption.
The aggregate expenditure curve has also shifted due to the change in consumption curve.
The equilibrium output level has also changed.
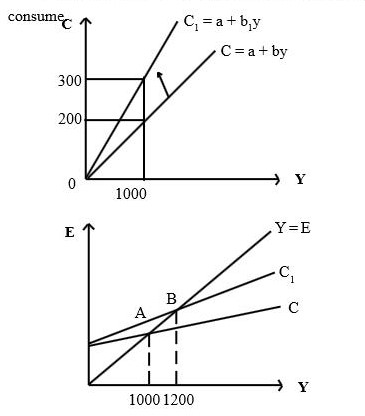
The equilibrium level can be changed with the change in Marginal Propensity t![fdgh (2)]()
- The slope of the consumption curve is changed because of change in marginal propensity to consume.
- Slope of Aggregate expenditure is also changed with the slope of consumption curve.
- The equilibrium level has also changed. In a simple economy, the equilibrium
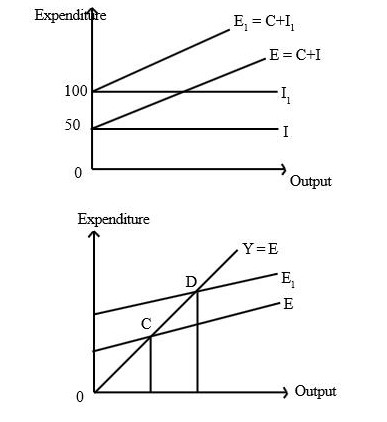
level has also changed due to change in investment.
![tuy (2)]()
Investment curve is changed due to change in investment.
When investment curve is changed, the expenditure curve also will be changed.
Therefore the equilibrium level of output also will be changed.
Because of the change in autonomous expenditure, the influence to change the output is
explained as the multiplier effect. (K)
The change in the autonomous expenditure of a simple economy, that is the
autonomous consumption and autonomous investment influence the multiplier effect.
Multiplier in a simple economy can be computed as follows.
Multiplier in a simple economy = K
K=1/(1-b)
b= Marginal Propensity to consume
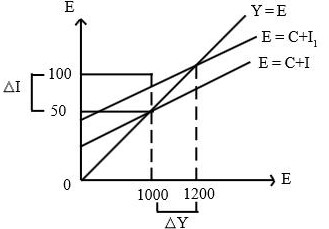
• This can be explained with a simple example. change in autonomous expenditure causes to change the output
This can be illustrated with the multiplier.
Y = (1/(1-b) )X ΔI
ΔY = Change in income
ΔI = Change in autonomous investment
- Change in output is computed with a multiplier when autonomous expenditure is changed.
This is explained with the following example.
Assuming Marginal Propensity to consume is 0.75 when investment (I) is increased
from 50 to 100.
Change in output is ,
ΔY = 1/(1-b) X I
ΔY = (1/ (1-0.75) )X (100-50)
ΔY = 4 x 50
ΔY =200
This can be illustrated with the following diagram
![ghj (2)]()
Multiplier effect can be also explained with a statistical table example.
Equillibrium level of output depends on a level of full employment or outer.
- Various objectives which society wants to fulfill are explained as macro economic
objectives.
- Expected targets to direct macro economic variables are named macro economic
objectives
Macro economic objectives are as follows
- Full employment
- Economic Stability
- Equity
- Economic growth
- Sustainable development
- Full employment means all resources of the economy which are used in maximum
efficiency to produce goods and services.
- Equity means to minimize the unequal distribution of income.
- Equity does not mean equal distribution of income among house holds.
- Earnings can be varied with quality of human resources and productivity but it is not
contradictory with equity.
- Macro economic stability is explained as maintaining the internal and external
stability in the economy.
- Price stability and full employment are important in internal stability.
- To maintain fixed foreign exchange rate and a balance B.O.P is important in external
stability
- The reason for economic growth is increase in real National Production for a period
of time and production possibilities curve will shift to the right in economic growth.
- Standard of living will increase if the increased real income is divided among
people fairly.
- Sustainable development is explained as a balanced development of economic,
social and environmental sectors.
When a closed economy is open to the foreign sector, it is called an open economy.
The components that are used to compute the equilibrium in an open economy are as follows.
- Consumption (C)
- Savings (S)
- Investment (I)
- Government purchases (G)
- Transfers (Tr)
- Autonomous taxes (T)
- Imports (M)
- Exports (X)
Equilibrium in an open economy can be explained through two approaches.
- Income and expenditure approach
- Withdrawals and Injections approach
- According to the income and expenditure method, equilibrium in open economy can be calculated as follows. Y = C+I+G+ (X-M)
- Equilibrium in an open economy also can be calculated using the withdrawals and Injections method.
Withdrawals= S+T+M
Injections = I+G+X
W = J
S+T+M = I+G+X
- Savings (S), autonomous taxes (T) and Imports (M) are considered as withdrawals.
- Investment (I) Government purchases (G) and Exports ( X) are considered as
injections.
- Equilibrium in an open economy can be presented with a statistical table and
graphically.
There are four main economic agents/ sectors that contribute to macro economic activity
• Households
• Business sector / Enterprises
• Government
• Foreign sector
- Macro economic is implemented with the transaction flows of economic sectors.
- These transactions flows can be illustrated with a simple diagram.This diagram is named, circular flows of income and expenditure.
- The economy which is implemented in households and the business sector is treated as a simple economy.
- In this simple economy savings is a withdrawal / leakage and investments is an injection.
- Aggregate income and aggregate expenditure are equal in a simple economy if savings and investments are equal.
- The functions of a simple economy can be illustrated with an income and expenditure flow, as savings that is either no savings and investments or there is savings and investments in the economy.
- The functions of a closed economy with government intervention to a simple economy
can also be illustrated with income and expenditure flow and can be illustrated with
income and expenditure
- In a closed economy, total of savings and taxes are the withdrawals and the total of
government purchases and investments are the injections.
- When taxes and savings are equal to the investments and government purchases, then
the aggregate income and aggregate expenditure are equal. That is Y =E.
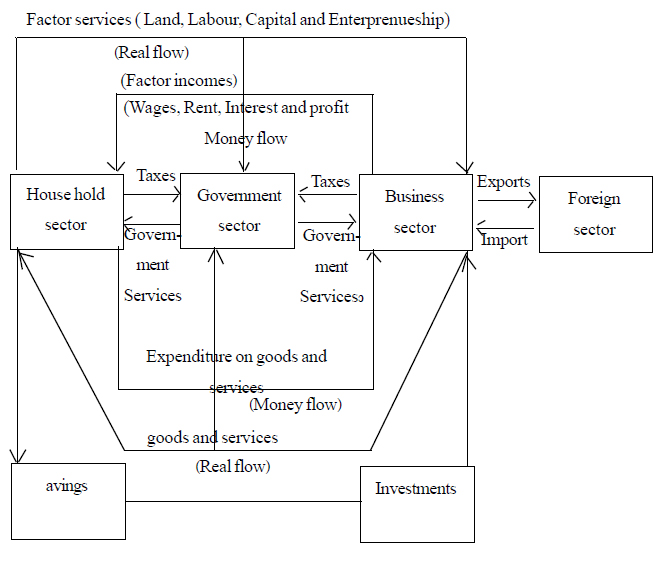
- If all four sectors function in the economy it is explained as illustrated by the
following income and expenditure flow.
- Income and expenditure flow of an open economy can be illustrated as follows
![Untitled-1tytr]()
- In an open economy, withdrawals are savings, taxes and imports while
investments, government purchases and exports are the injections
- When all withdrawals and injections are equal in the open economy, then the
aggregate income and expenditure are also equal.
- Income and expenditure flow explains, that production flow is equal to income flow,
and income flow is equal to expenditure flow. ·
- National income accounting estimates the value of production, income and
expenditure flows.
- Some items should be exchanged in national income accounting
The following items should be exchanged from National accounting
- Transactions in the money market.
- Exchanged of intermediate goods
When government intervenes in a simple economy, it is termed a closed economy
Therefore, the aggregate income and expenditure components include Taxes(T), Government purchases(G) and transfers(Tr).
Only autonomous taxes are considered as taxes.
The following components are used to compute the equilibrium in the economy.
- Consumption (C)
- Savings(S)
- Autonomous taxes (T)
- Government Purchases (G)
- Transfers (TR)
- Investment (I)
The equilibrium can be explained with two approaches.
- Income and expenditure method.
- Withdrawals and Injections method.
Aggregate expenditure in a closed economy can be explained as the sum of private consumption expenditure (C) Investment (I) and government purchases.
It can be shown with the following equation.
E = C+I+G
If Y = E
Y = C+I+G
- Aggregate income (Y) in a closed economy equal the sum of expenditure on private
consumption (C) Personal savings (S) and Autonomous taxes (T).
- It can be illustrated with the equation. Y = C+S+T
- Equilibrium in the closed economy can be shown through the withdrawals and injections method as,
E = C+I+G
Y = C+S+T
Y = E
C+I+G = C+S+T
I+G = S+T
- Illustrates (S) Savings and illustrates (T) Autonomous taxes. illustrates (I) Investment and is the (G) Government purchases.
- The consumption function in a closed economy can be illustrated as,
C = a+b (Y-T+TR)
a = Autonomous consumption
b = Marginal Propensity to consume
T =Autonomous taxes
TR = Transfers
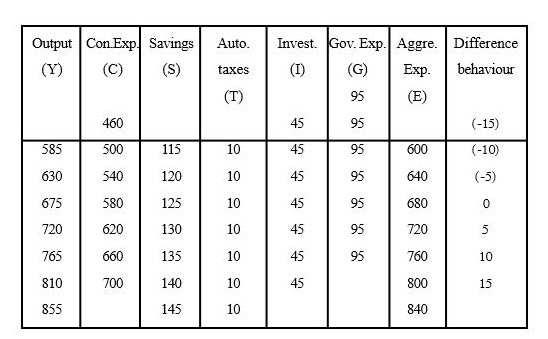
The equilibrium in a closed economy can be illustrated in the following ways.
- With a statistical table
- With graphical presentation
- With equations
The equilibrium in a closed economy is calculated based on statistical schedule.
![hrtru (2)]()
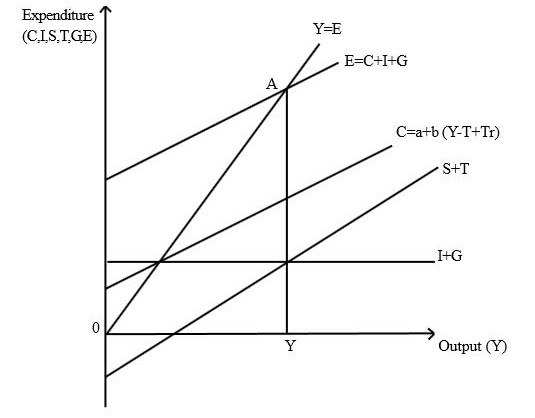
The equilibrium in a closed economy can be illustrated graphically.
![gert (2)]()
According to the above diagram point ‘A’ illustrates the equilibrium.