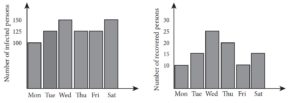
For questions 21 and 22, refer the following graphs which show the number of infected and recovered persons in each day from some non-fatal viral fever in a selected region during six consecutive days.
On which day a maximum number of persons got infected with the viral fever?