Please Login to view full dashboard.

Uses graphs and equations for market analysis.

Author : Admin

0  
Topic updated on 02/14/2019 09:34am

Any dynamic phenomenon could be identified as a variable

  • Economics studies the relationship of the economic variables
  • Various relationships exists among the variables
  • Any variable initiated to change the other variable is known as independent variable.
  • Changes that have taken place due to the changes of the independent variable is called
    the dependent variable
  • In accordance with the behavior of the independent variable ,the quantity of production
    and consumption could be shown by using a schedule.


If X is considered as the independent variable and Y as the dependent variable , changes of Y on X could be shown on a straight line in a graph as follows
Untitled-1gr

  • By drawing the impact of the above variables in a diagram, AB straight line could be
    derived
  • Relationship between the independent and dependent variables related to the straight line
    could be written as an equation such as:

Y= mx+ c
Y = mx + c in the equation, Y = dependent variable, X = independent variable
M = gradient/ slope, C = intercept

When there is a positive relationship between the independent variable and the dependent variable, the graph has a positive slope and this can be shown as follows.

Untitled-1fgtr
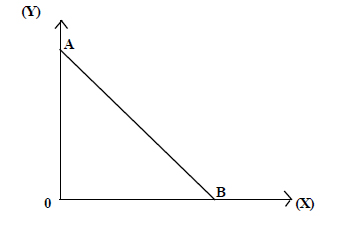
When there is a negative relationship between independent variable and the dependent
variable, the graph shows a negative slope as follows.

Untitled-2nhh
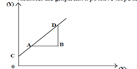
The ratio of the differences in independent variable and the dependent variable is the slope or gradient of the line and it could be computed as follows

Gradient/slope(b) = Difference in the horizontal axis / Difference in the vertical axis
The equation of a straight line : Y =a+ bx is applied in economics in this equation:
Y = dependent variable
a = Intercept
b =Gradient/ slope
x = Independent Variable

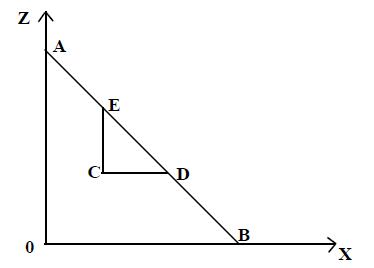
Slope of a straight line is constant

  • When the independent variable is Zero (0) the value given to the dependent variable is called the intercept (a)
  • If the independent and dependent variable of a straight-line, are given the above equation could be developed,
  • When the simple equation has been given the graph can be developed from it.
RATE CONTENT 0, 0
QBANK (0 QUESTIONS)
Comments Hide Comments(0)

Leave a Reply

Astan Publications
  • - This Questions is not available for FREE Users
  • - Please call us to become Premium Member
  • - Access to over 2000+ Questions & Answers
  • - Online active text through our Qbank